
Probability and Tree Diagram Demo by Dimitris Mirogiannis
Loading the math board and drawing, please wait…
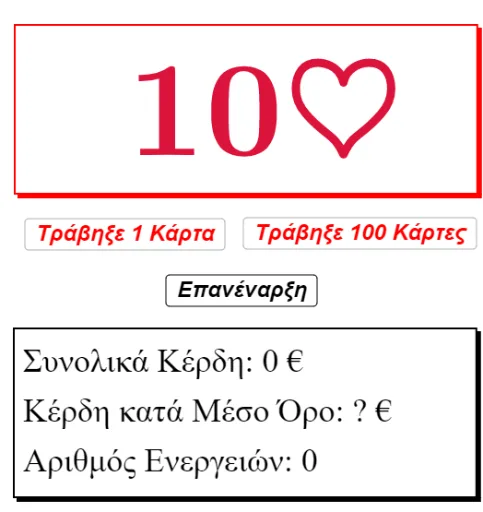
This example dynamically demonstrates the probability process of drawing playing cards, visually showing the construction and application of tree diagrams. It involves core math concepts like probability & statistics, percentages, hyperbolas, arithmetic mean, and random variables. GeoGebra commands used include Sequence, Join, Random, Length, DotPlot, CountIf, TableText, Sum, and Element for constructing the visualization. Suitable for high school probability & statistics teaching, helping understand random event probabilities and data visualization.
GeoGebra Commands & Parameters
Sequence(LaTeX["" + (w) + "\spadesuit", true], w, 2, 10) → L_1Join({L_1, L_2}) → spadesSequence(LaTeX["" + (w) + "\heartsuit", true], w, 2, 10) → L_3Join({L_3, L_4}) → heartsSequence(LaTeX["" + (w) + "\clubsuit", true], w, 2, 10) → L_5Join({L_5, L_6}) → clubsSequence(LaTeX["" + (w) + "\diamondsuit", true], w, 2, 10) → L_7Join({L_7, L_8}) → diamondJoin({clubs, diamond, hearts, spades}) → deckRandom(1, 52) → aLength(deck) → bDotPlot(win, false, 0.2) → L_9CountIf(x ≟ -7, win) → zeroCountIf(x ≟ 5, win) → fiveCountIf(x ≟ 10, win) → tenCountIf(x ≟ 30, win) → thirtyTableText({{"-7 €", " 5 €", "10 €", " 30 €"}, {zero, five, ten, thirty}}, "c|h") → text2Sum(win) → cSum(win) → totalElement(deck, a) → ww