
Probability and Tree Diagram (Copy)
Loading the math board and drawing, please wait…
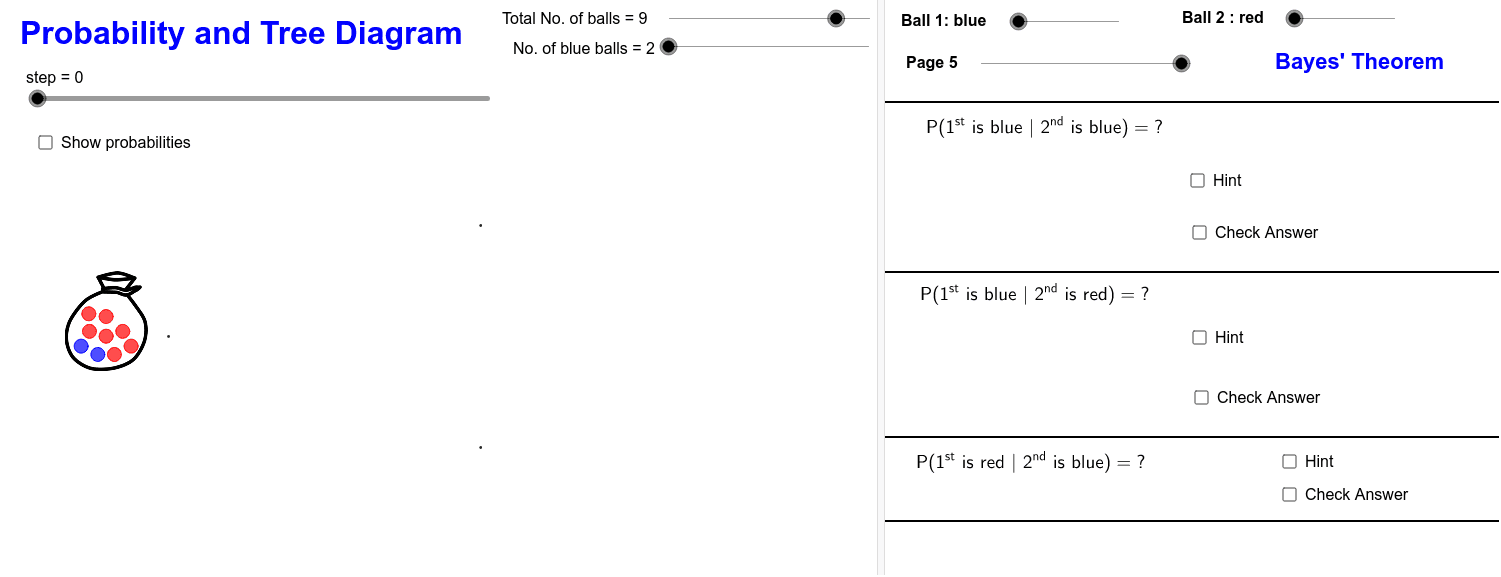
This GeoGebra example demonstrates a dynamic tree diagram for visualizing probability calculations, showing how branching structures represent multiple outcomes of a random experiment and their associated probabilities. Core mathematical concepts include conditional probability, independent events, the multiplication rule of probability, and tree diagram construction. The construction uses commands such as Sequence, Center, Point, Segment, and If, with objects like C21bY, C21bX, BallRadius, TotalBallNo, and various coordinate variables to model a ball-drawing experiment. Suitable for middle school to high school probability and statistics lessons, as well as introductory college courses, this interactive tool helps learners decompose complex probability problems into clear visual steps.
GeoGebra Commands & Parameters
Sequence(Circle[Element[Centre01, i], BallRadius], i, 2, NoB + 1) → BallBlueList01Center(Element[BallBlueList01, 1]) → AASequence(Circle[Element[Centre11, i], BallRadius], i, 2, NoB) → BallBlueList11Sequence(Circle[Element[Centre12, i], BallRadius], i, 2, NoB + 1) → BallBlueList12Sequence(Circle[Element[Centre21, i], BallRadius], i, 2, NoB - 1) → BallBlueList21Sequence(Circle[Element[Centre22, i], BallRadius], i, 2, NoB) → BallBlueList22Sequence(Circle[Element[Centre24, i], BallRadius], i, 2, NoB + 1) → BallBlueList24Sequence(Circle[Element[Centre23, i], BallRadius], i, 2, NoB) → BallBlueList23Sequence(If[step ≤ 10, (FindCor(step, 0, 10, x(Element[Tree01Point, i]), x(Element[Tree02Point, i])), FindCor(step, 0, 10, y(Element[Tree01Point, i]), y(Element[Tree02Point, i]))), Element[Tree02Point, i]], i, 1, 2) → Tree02MovingPointSequence(Segment[Element[Tree01Point, i], Element[Tree02MovingPoint, i]], i, 1, 2) → TreeLine01Sequence(If[step < 35, Element[Tree03Point, i], If[step > 45, Element[Tree04Point, i], (FindCor(step, 35, 45, x(Element[Tree03Point, i]), x(Element[Tree04Point, i])), FindCor(step, 35, 45, y(Element[Tree03Point, i]), y(Element[Tree04Point, i])))]], i, 1, 4) → Tree04MovingPointSequence(Segment[Element[Tree03Point, i], Element[Tree04MovingPoint, i]], i, 1, 4) → TreeLine02If(step < 20, Element[Centre11, NoB + 1], If[step > 30, C11a, (FindCor(step, 20, 30, x(Element[Centre11, NoB + 1]), x(C11a)), FindCor(step, 20, 30, y(Element[Centre11, NoB + 1]), y(C11a)))]) → C11aMoveIf(step < 20, Element[Centre12, NoB + 2], If[step > 30, C12a, (FindCor(step, 20, 30, x(Element[Centre12, NoB + 2]), x(C11a)), FindCor(step, 20, 30, y(Element[Centre12, NoB + 2]), y(C12a)))]) → C12aMoveIf(step < 50, Element[Centre21, NoB], If[step > 60, C21b, (FindCor(step, 50, 60, x(Element[Centre21, NoB]), x(C21b)), FindCor(step, 50, 60, y(Element[Centre21, NoB]), y(C21b)))]) → C21bMoveIf(step < 50, Element[Centre23, NoB + 1], If[step > 60, C23b, (FindCor(step, 50, 60, x(Element[Centre23, NoB + 1]), x(C23b)), FindCor(step, 50, 60, y(Element[Centre23, NoB + 1]), y(C23b)))]) → C23bMoveIf(step < 50, Element[Centre24, NoB + 3], If[step > 60, C24b, (FindCor(step, 50, 60, x(Element[Centre24, NoB + 3]), x(C24b)), FindCor(step, 50, 60, y(Element[Centre24, NoB + 3]), y(C24b)))]) → C24bMoveIf(step < 50, Element[Centre22, nb + 1], If[step > 60, C22b, (FindCor(step, 50, 60, x(Element[Centre22, nb + 1]), x(C22b)), FindCor(step, 50, 60, y(Element[Centre22, nb + 1]), y(C22b)))]) → C22bMoveSequence(Circle[Element[BlueSelectedMovingCentreList, i], BallRadius], i, 1, 1) → BallBlueSelectedList01Sequence(Circle[Element[RedSelectedMovingCentreList, i], BallRadius], i, 2, 5) → BallRedSelectedList02Sequence(Circle[Element[RedSelectedMovingCentreList, i], BallRadius], i, 1, 1) → BallRedSelectedList01Sequence(Circle[Element[BlueSelectedMovingCentreList, i], BallRadius], i, 2, 5) → BallBlueSelectedList02Sequence(Circle[Element[Centre01, i], BallRadius], i, NoB + 2, nb + 1) → BallRedList01Sequence(Circle[Element[Centre11, i], BallRadius], i, NoB + 2, nb + 1) → BallRedList11Sequence(Circle[Element[Centre12, i], BallRadius], i, NoB + 3, nb + 1) → BallRedList12Sequence(Circle[Element[Centre22, i], BallRadius], i, NoB + 2, nb) → BallRedList22Sequence(Circle[Element[Centre23, i], BallRadius], i, NoB + 3, nb + 1) → BallRedList23Sequence(Circle[Element[Centre24, i], BallRadius], i, NoB + 4, nb + 1) → BallRedList24Sequence(Circle[Element[Centre21, i], BallRadius], i, NoB + 2, nb + 1) → BallRedList21Point(tempL11) → Z17Segment(Z17, Z08) → i
AI Drawing Prompt Reference
Create a dynamic tree diagram to visualize probability calculations, showing multiple branching structures representing different outcomes of a random experiment and their associated probabilities. The diagram should include several blue and red balls distributed across various nodes, with some nodes changing positions over time. The tree has 2 branches at the first level, 4 branches at the second level, and 2 branches at the third level, each with several balls. The tree structure should clearly illustrate the propagation of probabilities and the selection process at each branch, suitable for teaching probability and statistics concepts.
The prompt above was compiled from the original drawing commands and is for reference only.