
Probability and Tree Diagram by Ole
Loading the math board and drawing, please wait…
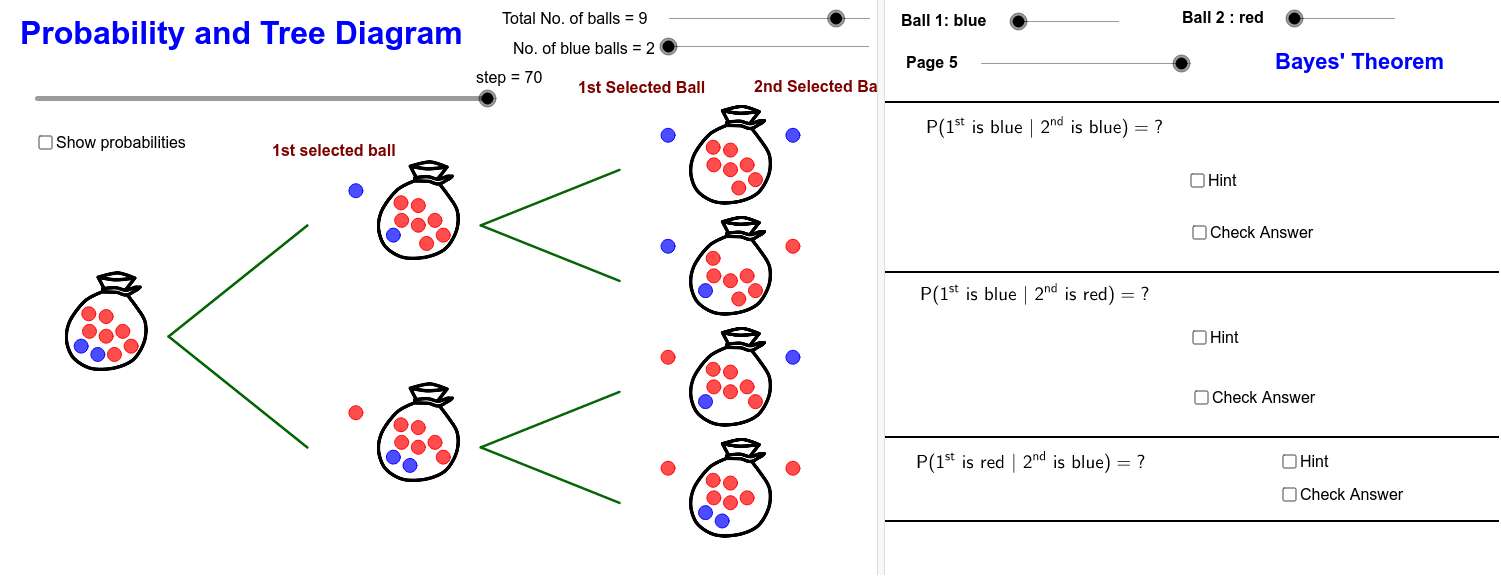
This example demonstrates the concept of probability and tree diagrams. It covers the basic principles of probability and uses tree diagrams to illustrate the probability distribution of different events. The construction involves commands such as Sequence, Center, If, Point, and Segment in GeoGebra. Suitable for students at the junior high school level and above for learning probability and statistics.
GeoGebra Commands & Parameters
Sequence(Circle[Element[Centre01, i], BallRadius], i, 2, NoB + 1) → BallBlueList01Center(Element[BallBlueList01, 1]) → AASequence(Circle[Element[Centre11, i], BallRadius], i, 2, NoB) → BallBlueList11Sequence(Circle[Element[Centre12, i], BallRadius], i, 2, NoB + 1) → BallBlueList12Sequence(Circle[Element[Centre21, i], BallRadius], i, 2, NoB - 1) → BallBlueList21Sequence(Circle[Element[Centre22, i], BallRadius], i, 2, NoB) → BallBlueList22Sequence(Circle[Element[Centre24, i], BallRadius], i, 2, NoB + 1) → BallBlueList24Sequence(Circle[Element[Centre23, i], BallRadius], i, 2, NoB) → BallBlueList23Sequence(If[step ≤ 10, (FindCor(step, 0, 10, x(Element[Tree01Point, i]), x(Element[Tree02Point, i])), FindCor(step, 0, 10, y(Element[Tree01Point, i]), y(Element[Tree02Point, i]))), Element[Tree02Point, i]], i, 1, 2) → Tree02MovingPointSequence(Segment[Element[Tree01Point, i], Element[Tree02MovingPoint, i]], i, 1, 2) → TreeLine01Sequence(If[step < 35, Element[Tree03Point, i], If[step > 45, Element[Tree04Point, i], (FindCor(step, 35, 45, x(Element[Tree03Point, i]), x(Element[Tree04Point, i])), FindCor(step, 35, 45, y(Element[Tree03Point, i]), y(Element[Tree04Point, i])))]], i, 1, 4) → Tree04MovingPointSequence(Segment[Element[Tree03Point, i], Element[Tree04MovingPoint, i]], i, 1, 4) → TreeLine02If(step < 20, Element[Centre11, NoB + 1], If[step > 30, C11a, (FindCor(step, 20, 30, x(Element[Centre11, NoB + 1]), x(C11a)), FindCor(step, 20, 30, y(Element[Centre11, NoB + 1]), y(C11a)))]) → C11aMoveIf(step < 20, Element[Centre12, NoB + 2], If[step > 30, C12a, (FindCor(step, 20, 30, x(Element[Centre12, NoB + 2]), x(C11a)), FindCor(step, 20, 30, y(Element[Centre12, NoB + 2]), y(C12a)))]) → C12aMoveIf(step < 50, Element[Centre21, NoB], If[step > 60, C21b, (FindCor(step, 50, 60, x(Element[Centre21, NoB]), x(C21b)), FindCor(step, 50, 60, y(Element[Centre21, NoB]), y(C21b)))]) → C21bMoveIf(step < 50, Element[Centre23, NoB + 1], If[step > 60, C23b, (FindCor(step, 50, 60, x(Element[Centre23, NoB + 1]), x(C23b)), FindCor(step, 50, 60, y(Element[Centre23, NoB + 1]), y(C23b)))]) → C23bMoveIf(step < 50, Element[Centre24, NoB + 3], If[step > 60, C24b, (FindCor(step, 50, 60, x(Element[Centre24, NoB + 3]), x(C24b)), FindCor(step, 50, 60, y(Element[Centre24, NoB + 3]), y(C24b)))]) → C24bMoveIf(step < 50, Element[Centre22, nb + 1], If[step > 60, C22b, (FindCor(step, 50, 60, x(Element[Centre22, nb + 1]), x(C22b)), FindCor(step, 50, 60, y(Element[Centre22, nb + 1]), y(C22b)))]) → C22bMoveSequence(Circle[Element[BlueSelectedMovingCentreList, i], BallRadius], i, 1, 1) → BallBlueSelectedList01Sequence(Circle[Element[RedSelectedMovingCentreList, i], BallRadius], i, 2, 5) → BallRedSelectedList02Sequence(Circle[Element[RedSelectedMovingCentreList, i], BallRadius], i, 1, 1) → BallRedSelectedList01Sequence(Circle[Element[BlueSelectedMovingCentreList, i], BallRadius], i, 2, 5) → BallBlueSelectedList02Sequence(Circle[Element[Centre01, i], BallRadius], i, NoB + 2, nb + 1) → BallRedList01Sequence(Circle[Element[Centre11, i], BallRadius], i, NoB + 2, nb + 1) → BallRedList11Sequence(Circle[Element[Centre12, i], BallRadius], i, NoB + 3, nb + 1) → BallRedList12Sequence(Circle[Element[Centre22, i], BallRadius], i, NoB + 2, nb) → BallRedList22Sequence(Circle[Element[Centre23, i], BallRadius], i, NoB + 3, nb + 1) → BallRedList23Sequence(Circle[Element[Centre24, i], BallRadius], i, NoB + 4, nb + 1) → BallRedList24Sequence(Circle[Element[Centre21, i], BallRadius], i, NoB + 2, nb + 1) → BallRedList21Point(tempL11) → Z17Segment(Z17, Z08) → i
AI Drawing Prompt Reference
Draw an example of probability and tree diagrams to illustrate basic probability principles. Include multiple blue and red balls distributed around various center points in a sequential manner, forming multiple levels. The tree diagram part has two branches showing the probability distribution of events, with moving points and connecting lines, some points changing positions based on steps. The overall construction starts from the basic ball distribution and moves to the dynamic changes in the tree diagram.
The prompt above was compiled from the original drawing commands and is for reference only.