
Probability and Bar Chart Optimization Exercise
Loading the math board and drawing, please wait…
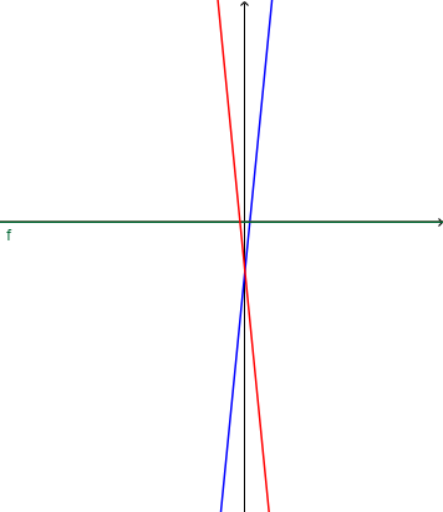
This example demonstrates how to use GeoGebra to construct bar charts for probability distributions and show how to adjust parameters through optimization problems. The core math concepts involved include Probability & Statistics, Frequency Distribution, Upper and Lower Sum or Riemann Sum. Construction highlights the use of commands like Random, RandomElement, Textfield, Mirror, TableText, and objects such as d_2, c_1, c, a, b, g, a_1, button1, h, A1, f, InputBox1, b_1, d_1, A1_1, B1_1, C_1, D_1, m, InputBox2, p, e, l, k, InputBox4, n, B_1, B, text2, A, g_1, text3_1. Suitable for high school mathematics teaching, for practical applications in probability statistics and optimization problems.
GeoGebra Commands & Parameters
Random(-10, 10) → d_2RandomElement({-5, -4, -3, -2, -1, 1, 2, 3, 4, 5}) → c_1RandomElement({-5, -4, -3, -2, -1, 1, 2, 3, 4, 5}) → cRandom(-10, 10) → aRandom(-10, 10) → bRandomElement({-5, -4, -3, -2, -1, 1, 2, 3, 4, 5}) → a_1Textfield(h) → InputBox1Random(-10, 10) → b_1Random(-10, 10) → d_1Textfield(m) → InputBox2Textfield(f) → InputBox4Mirror(g, yAxis) → g_1TableText({{A1_1, B_1, C_1, D_1}, {-3, g(-3), h(-3), f(-3)}, {-2, g(-2), h(-2), f(-2)}, {-1, g(-1), h(-1), f(-1)}, {0, g(0), h(0), f(0)}, {1, g(1), h(1), f(1)}, {2, g(2), h(2), f(2)}, {3, g(3), h(3), f(3)}, {m, e, l, k}}, "|_r") → text3_1
AI Drawing Prompt Reference
Create a bar chart to visualize probability distributions with randomly generated values and parameters, showing how adjustments through optimization problems affect the chart. Include multiple bars where each bar's height represents the probability of different values, labeled with ranges and probabilities. Start with a set of random values, then allow parameter adjustments via buttons or input boxes to see changes in the bar chart, demonstrating the application of probability statistics and optimization.
The prompt above was compiled from the original drawing commands and is for reference only.