
Practice Using Paired Numbers
Loading the math board and drawing, please wait…
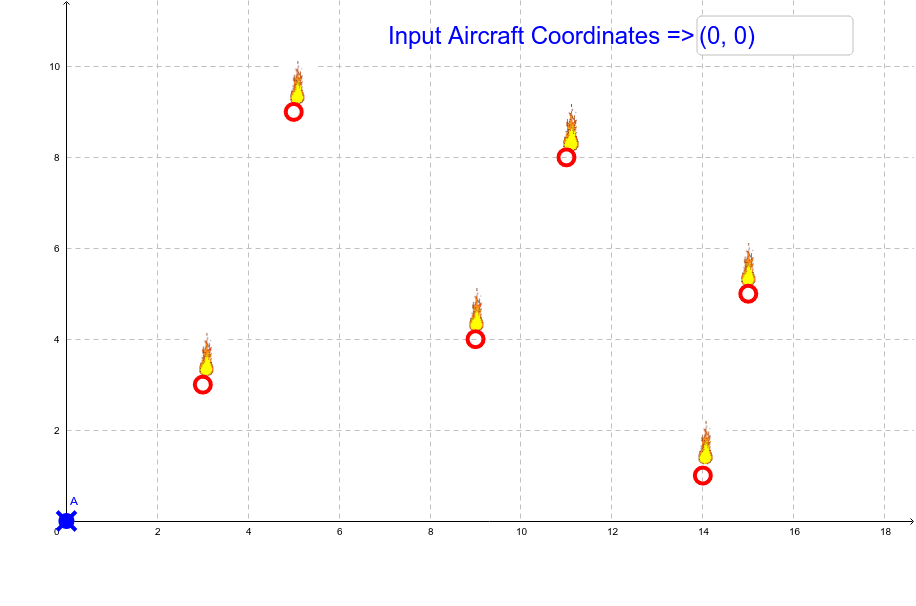
This example demonstrates how to use paired numbers to plot linear function graphs in a coordinate system and analyze their relationship with special points. Core math concepts include linear functions, paired numbers, special points (vertices, midpoints), and median lines. Construction highlights involve using the Textfield command to display information and objects like pic2, pic1, pic1_1, pic1_2, pic1_3, pic1_4, pic1_5, B, C, D, E, F, G, A, inputBox1 to build graphics and interactions. Suitable for high school mathematics teaching to help students understand the characteristics of linear function graphs and the application of paired numbers.
GeoGebra Commands & Parameters
Textfield(A) → inputBox1
AI Drawing Prompt Reference
Draw a coordinate system and plot a linear function graph. Use paired numbers to represent the linear function and analyze the relationship between these points and special points (vertices, midpoints). Display information through a text box, including paired numbers, special points (vertices, midpoints), and median lines. Start by creating the coordinate system, then plot the linear function, mark the special points, and finally display the information through the text box.
The prompt above was compiled from the original drawing commands and is for reference only.