
Practice Solving Inequalities by Terry Lee Lindenmuth
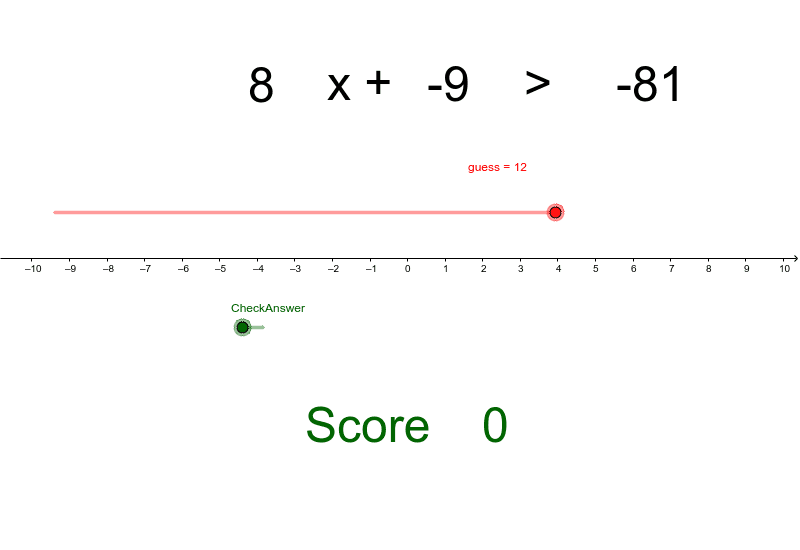
Loading the math board and drawing, please wait…
In collections
Geom. & Alg.: Systems Equations & Linear Programming
This example demonstrates how to solve inequalities using GeoGebra. Key mathematical concepts include linear functions and inequalities. Users can dynamically explore the solution set of inequalities using commands like Random, Text, If, and Ray. Suitable for middle school and above students or teachers.
GeoGebra Commands & Parameters
Random(-10, 10) → answerRandom(-10, 10) → bRandom(1, 10) → mText(m) → text1Text(b) → text3Text(k) → text5Text(score) → text6If(answer ≟ guess, 1, 0) → addptRay(A, B) → a
AI Drawing Prompt Reference
Draw a dynamic graph with a randomly generated line and inequality. First, draw a line with slope m and y-intercept b. Then, shade the area based on the inequality ax + by > c, where a and b are generated from m and b. Finally, use a ray to display the line.
The prompt above was compiled from the original drawing commands and is for reference only.