
Practice Finding Slope (Randomly Generated Lines)
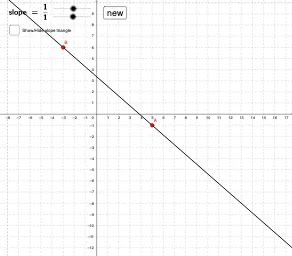
Loading the math board and drawing, please wait…
In collections
Coordinates and Linear Equations
① This example demonstrates how to identify and calculate the slope of a randomly generated line using interactive sliders and visual feedback. ② The core mathematical concept is the definition of slope (change in y over change in x), including fraction simplification and sign interpretation. ③ Construction details: The GeoGebra commands used include Line to create the line, Vector to represent rise and run, GCD to simplify the fraction, Polygon and Segment to form a right triangle, Slider for numerator and denominator inputs, Text for messages, and Button1 to reset with a new random line. ④ Suitable for middle or high school students learning slope, as well as for classroom demonstrations or self-paced practice, reinforcing understanding of positive/negative slope, magnitude, and fractional representation through repeated random exercises.
GeoGebra Commands & Parameters
Line(A, B) → aVector(B, C) → uVector(C, A) → vGCD(rawrise, rawrun) → reducebyPolygon(D, E, F, G) → poly1, d, e, f, gSegment(H, I) → c
AI Drawing Prompt Reference
Create a coordinate-geometry exercise graphic for practicing slope. Start by choosing two points to define a line, then show the line’s direction using two vectors representing rise (change in y) and run (change in x). Include a fractional slope message that expresses rise over run and indicates the numerator and denominator can be reduced by a common divisor. Construct a right triangle by connecting the relevant points with a polygon and emphasize one key side using a segment. Add a text prompt and a reset/re-generate control to generate a new random line.
The prompt above was compiled from the original drawing commands and is for reference only.