
Graph the Line (v.2) – Drag Points A and B
Loading the math board and drawing, please wait…
In collections
Coordinates and Linear Equations
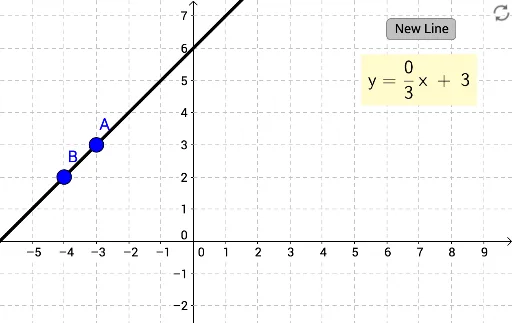
This GeoGebra example demonstrates how to graph a line by dragging two free points A and B, illustrating the fundamental principle that two points determine a unique straight line. The core mathematical concepts involve coordinate geometry, linear equations, slope, and intercepts. Construction details: the Random command generates random values for the y-intercept (generatedyintercept), run (generatedrun), and rise (generatedrise) to define the line's parameters; points A and B are created as draggable points on the line; the Line command connects them to form the graph; a button (button1) and text objects (text1, text2) provide interactive guidance. This activity is suitable for middle or high school students learning about linear functions, slope, and graphing, and serves as an effective classroom tool for exploring how changing point positions affects the line's equation and visual representation.
GeoGebra Commands & Parameters
Random(-4, 4) → generatedyinterceptRandom(1, 6) → generatedrunRandom(-6, 6) → generatedriseLine(A, B) → b
AI Drawing Prompt Reference
Draw a line determined by randomly generated y-intercept, run, and rise. First, generate random values for the y-intercept, horizontal change, and vertical change. Then create two draggable points on the line and connect them with a line to form the graph. Add a button and two text boxes to demonstrate how dragging the points changes the line's equation and visual representation interactively.
The prompt above was compiled from the original drawing commands and is for reference only.