
Practice Creating Bar Graphs
Loading the math board and drawing, please wait…
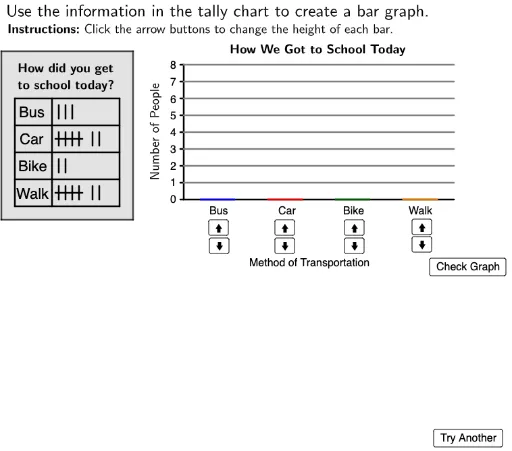
This example demonstrates how to create bar graphs using GeoGebra, involving core math concepts like bar charts, integral calculus, triangles, arithmetic, continuity, and inequalities. Key GeoGebra commands and objects used include RotateText, Polygon, Sequence, and elements like TryAnother and Instructions for constructing the graph. Suitable for middle school students and above or math enthusiasts for data visualization practice.
GeoGebra Commands & Parameters
RotateText("Number of People", π / 2) → XlabelPolygon((-0.4, 6.4), (3.5, 6.4), (3.5, 1.4), (-0.4, 1.4)) → TableOutline, f, g, h, iSequence(Segment[(4.9, a), (5, a)], a, 2, 6, 0.5) → TicksPolygon((5.5, 2), (6.5, 2), (6.5, height1), (5.5, height1)) → bar1, j, k, l, mPolygon((7.5, 2), (8.5, 2), (8.5, height2), (7.5, height2)) → bar2, n, p, q, rPolygon((9.5, 2), (10.5, 2), (10.5, height3), (9.5, height3)) → bar3, s, t, a, bPolygon((11.5, 2), (12.5, 2), (12.5, height4), (11.5, height4)) → bar4, c, d, e, f_1Sequence(Segment[(5, a), (13, a)], a, 2.5, 6, 0.5) → GridLinesPolygon((0, -3), (0, -2.3), (0.7, -2.3), (0.7, -3)) → Q2Box, k_1, l_1, m_1, n_1Polygon((0, -2), (0, -1.3), (0.7, -1.3), (0.7, -2)) → Q1Box, g_1, h_1, i_1, j_1Polygon((0, -4), (0, -3.3), (0.7, -3.3), (0.7, -4)) → Q3Box, p_1, q_1, r_1, s_1
AI Drawing Prompt Reference
Create a mathematical graph featuring a bar chart that demonstrates integral calculus, triangles, and inequalities. The graph includes a horizontal axis with numerical labels. Four bars of varying heights are arranged from left to right, each topped with tick marks. On the left side, there are four small rectangular boxes at different heights, representing inequality regions. Construct the graph by first drawing the horizontal axis and tick marks, then the bars and small boxes.
The prompt above was compiled from the original drawing commands and is for reference only.