
Power Functions with Roll Time Data
Loading the math board and drawing, please wait…
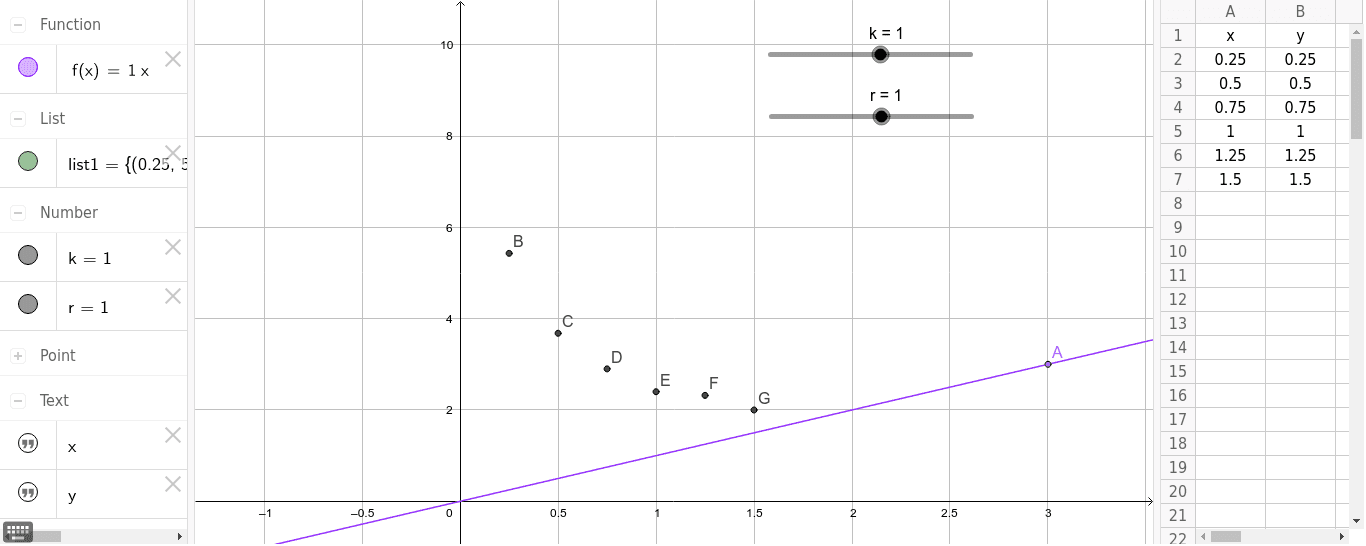
This example demonstrates power functions and their correlation with rolling time data, involving core concepts like functions, power functions, ratios, hypothesis testing, expected value, and correlation. It constructs data points and function graphs using GeoGebra commands like Point, sliders (k, r), functions (f), and lists (list1), suitable for high school and above in mathematics education for understanding function graphs, data analysis, and statistical applications.
GeoGebra Commands & Parameters
Point(f) → A
AI Drawing Prompt Reference
Draw a graph of a power function and rolling time data. First, create a power function f(x) = k*x^r with parameters k and r. Then, plot rolling time data points representing values over time. Next, compare the function graph with the data points to show their correlation. Ensure the graph is clear and labels key points to help understand the relationship between the function and data.
The prompt above was compiled from the original drawing commands and is for reference only.