
Polynomial Functions and Graph Analysis
Loading the math board and drawing, please wait…
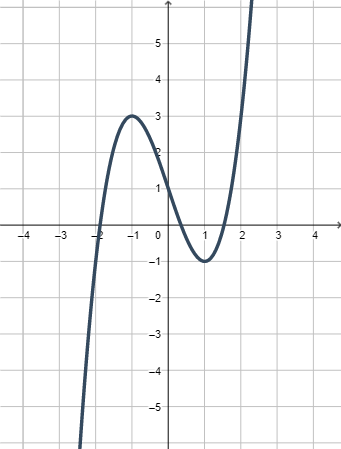
This example demonstrates the characteristics of polynomial function graphs and their relationship with the coordinate axes. Key mathematical concepts include polynomial functions, power functions, and quadratic equations. Construction involves GeoGebra commands f, g, h to create polynomial function graphs. Suitable for high school students learning function graph transformations and properties of polynomials.
GeoGebra Commands & Parameters
f(x) = x^(3) - (3 * x) + 1g(x) = (-f(x))h(x) = f((-x))
AI Drawing Prompt Reference
On a coordinate plane, plot three polynomial function graphs: first draw y=f(x)=x^3-3x+1, then draw y=g(x)=-f(x), the reflection of f across the x-axis, and finally draw y=h(x)=f(-x), which is the graph obtained by substituting x with −x in f. Keep all three curves in the same coordinate system so their relationships to the coordinate axes and to each other are clearly visible.
The prompt above was compiled from the original drawing commands and is for reference only.