
Polynomial Function Zeros Solver
Loading the math board and drawing, please wait…
In collections
Thomas S - Working with Polynomial Functions in IM3
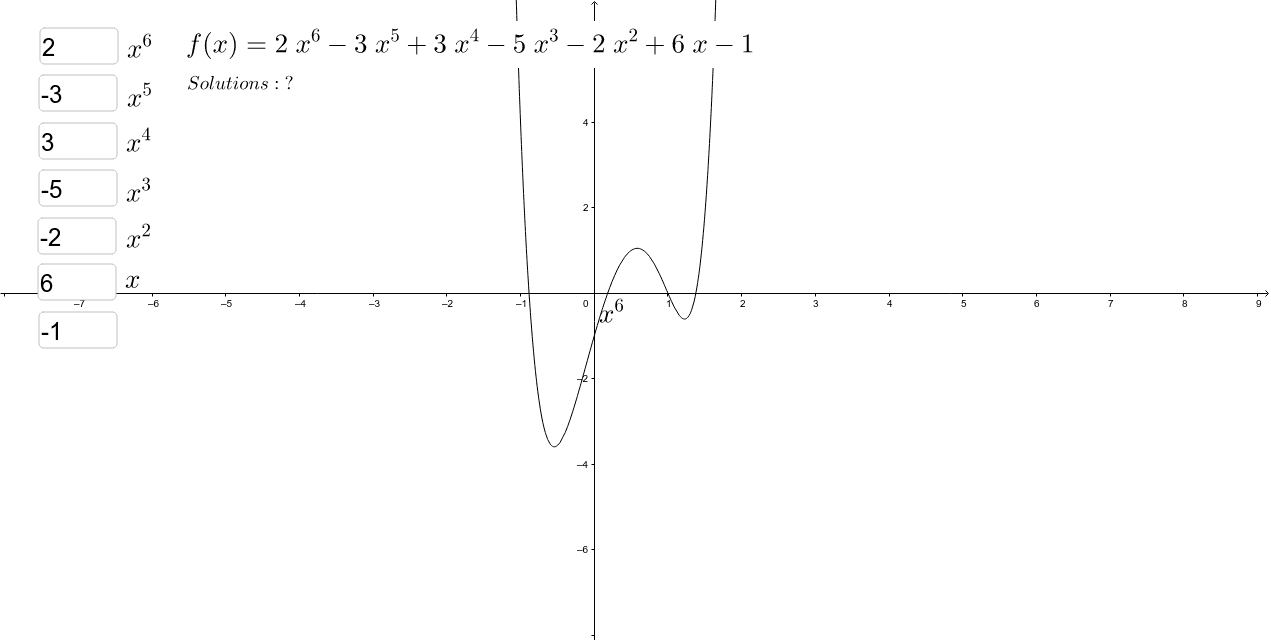
This example demonstrates the solution and visualization of zeros for polynomial functions. It involves core math concepts like polynomial functions, zeros, and function graphing. Construction highlights include the use of Textfield commands to create multiple text objects (a, b, c, d, e, g, h, f, list1, A, B, C, D, E, F, G, text1, text1_1, text1_2, text1_3, text1_4, text1_5, text1_6, text2, text3) for display and interaction. Suitable for high school and above mathematics learners to explore polynomial function properties.
GeoGebra Commands & Parameters
Textfield(a) → ATextfield(b) → BTextfield(c) → CTextfield(d) → DTextfield(e) → ETextfield(g) → FTextfield(h) → G
AI Drawing Prompt Reference
Create an interactive graph for solving polynomial function zeros. Display seven input fields arranged in a row, each labeled with a letter to represent coefficients and the constant term. Show a coordinate system with a polynomial curve plotted based on these inputs. As the user changes the values in the fields, the curve updates in real time, and the x-intercepts (zeros) are highlighted on the graph. The layout should be clean and suitable for math education.
The prompt above was compiled from the original drawing commands and is for reference only.