
Identifying Polynomial Functions from Graphs
Loading the math board and drawing, please wait…
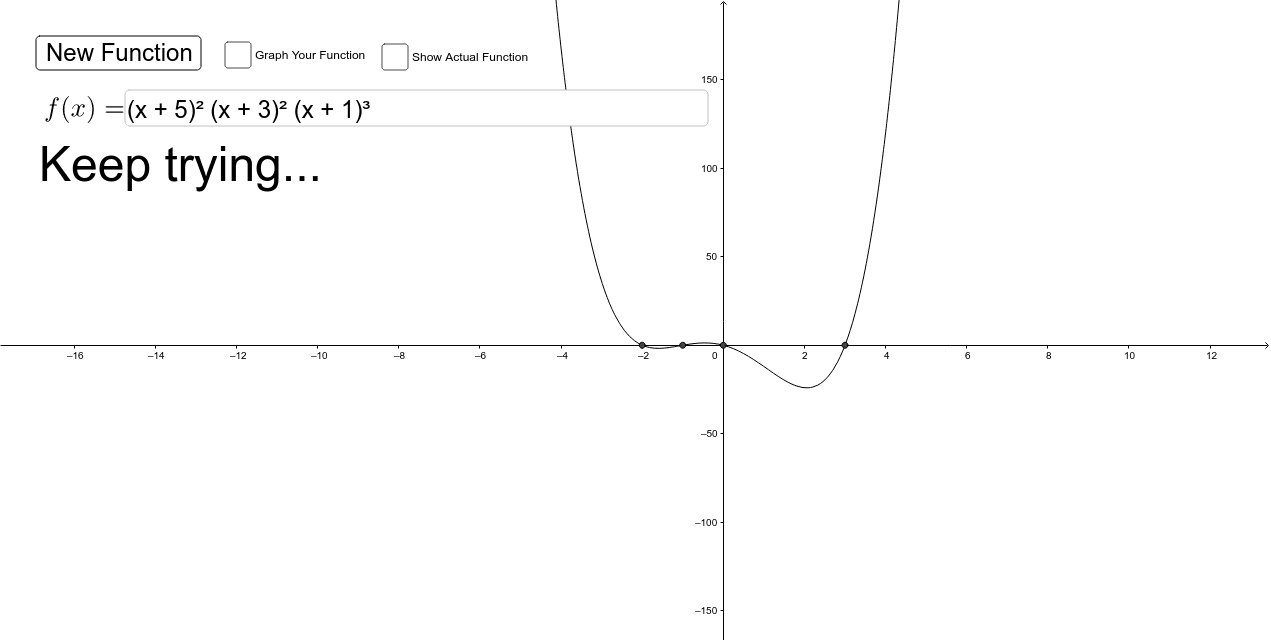
This example demonstrates how to identify polynomial functions by analyzing their graph characteristics. Key math concepts include properties of polynomial functions, the relationship between graphs and coefficients, roots, and derivatives. GeoGebra commands used are RandomElement, Random, Factor, Textfield, Root, and If. Suitable for high school mathematics education, helping students understand the connection between polynomial function graphs and algebraic expressions.
GeoGebra Commands & Parameters
RandomElement({-1, 1}) → negRandom(-5, 5) → aRandom(-5, 5) → bRandom(-5, 5) → cRandom(-5, 5) → dRandom(-5, 5) → eRandom(-5, 5) → fFactor(Expand[RandomElement[{f2, f2a, f2b, f3, f3a, f3b, f3c, f4, f4a, f4b, f5, f5a, f5b, f6, f6a}]]) → funcTextfield(userFunc) → userFunctionBoxRoot(func) → A, B, C, D, E, FIf(userFunc ≟ func, "Correct!", "Keep trying...") → correct
AI Drawing Prompt Reference
Draw a randomly generated polynomial function graph, showing the relationship between its roots and coefficients, include a text box displaying the function expression, and show 'Correct!' if the expression is right or 'Keep trying...' if not.
The prompt above was compiled from the original drawing commands and is for reference only.