
Polynomial Function Graphs; Long and Synthetic Division
Loading the math board and drawing, please wait…
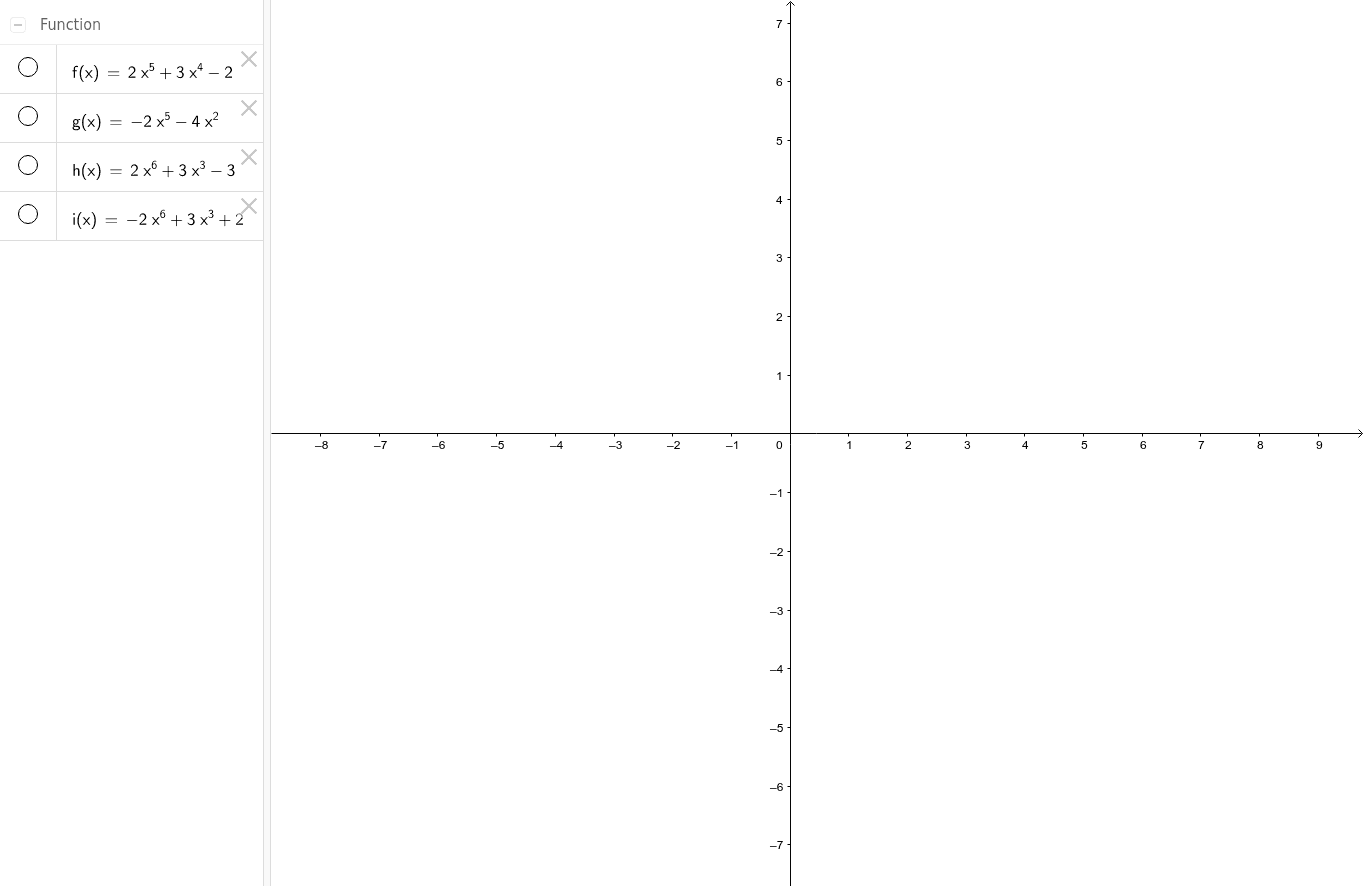
This example demonstrates the graphing of polynomial functions along with the application of long and synthetic division. Key math concepts include polynomial functions, function graphs, long division, synthetic division, and factoring. It utilizes GeoGebra commands/objects: objects f, g, h, i. Suitable for high school mathematics education to help students understand the properties of polynomial functions and the role of division operations in function analysis.
GeoGebra Commands & Parameters
f(x) = (2 * x^(5)) + (3 * x^(4)) - 2g(x) = (-2 * x^(5)) - (4 * x^(2))h(x) = (2 * x^(6)) + (3 * x^(3)) - 3i(x) = (-2 * x^(6)) + (3 * x^(3)) + 2
AI Drawing Prompt Reference
Graph two quintic polynomial functions and two sextic polynomial functions to display their growth trends and shapes. First plot the functions f(x) = 2x^5 + 3x^4 - 2 and g(x) = -2x^5 - 4x^2 to observe their symmetry and behavior. Then plot h(x) = 2x^6 + 3x^3 - 3 and i(x) = -2x^6 + 3x^3 + 2, comparing their differences and relating them to the quintic functions. Ensure all graphs are clear for analyzing their mathematical properties and relationships.
The prompt above was compiled from the original drawing commands and is for reference only.