
Polygon Area and Transformation Demo by Martin Flashman
Loading the math board and drawing, please wait…
In collections
Mapping Diagrams: From AB to C&DE, Resource
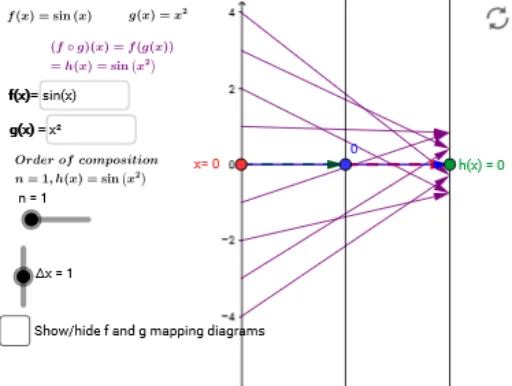
This example demonstrates the calculation and visualization of polygon area after translation transformation; Core math concepts include polygon area, translation vector, Pythagorean theorem, and bar chart data display; GeoGebra commands/objects used in construction are Point, If, Vector, Sequence, Zip, Textfield, such as implementing translation with Vector, generating point sequences with Sequence, and merging data with Zip; Suitable for high school mathematics teaching, for understanding geometric transformations and area calculations, and also for data visualization education.
GeoGebra Commands & Parameters
Element(f1list, n) → f_1Element(f2list, n) → f_2Point(yAxis) → AIf(n ≟ 1, (2, g(y(A))), (2, f(y(A)))) → BVector(A, B) → uVector(B, C) → vVector(A, C) → wSequence(k, k, -4, 4, Δx) → xlistZip((k, h(k)), k, xlist) → pthlistZip(Vector[(0, k), (x(C), h(k))], k, xlist) → vhlistZip(Vector[(0, k), (x(B), f_1(k))], k, xlist) → vf1listTextfield(g) → inputBoxgTextfield(f) → inputBoxfZip(Vector[(x(B), f_1(k)), (x(C), h(k))], k, xlist) → vf2list
AI Drawing Prompt Reference
Draw a coordinate plane with a polygon and its translated copy. Place a point on the y-axis as a reference, then create a translation vector from it to move the polygon. Generate a series of equally spaced points along the x-axis, and from each point draw vertical or horizontal vectors to form a grid-like data display. Include two editable input boxes for adjusting function expressions that control the polygon's shape and area. Finally, show the area change before and after translation using a bar chart or numeric labels, and illustrate the Pythagorean theorem in distance calculations.
The prompt above was compiled from the original drawing commands and is for reference only.