
Polar Graphs - 8
Loading the math board and drawing, please wait…
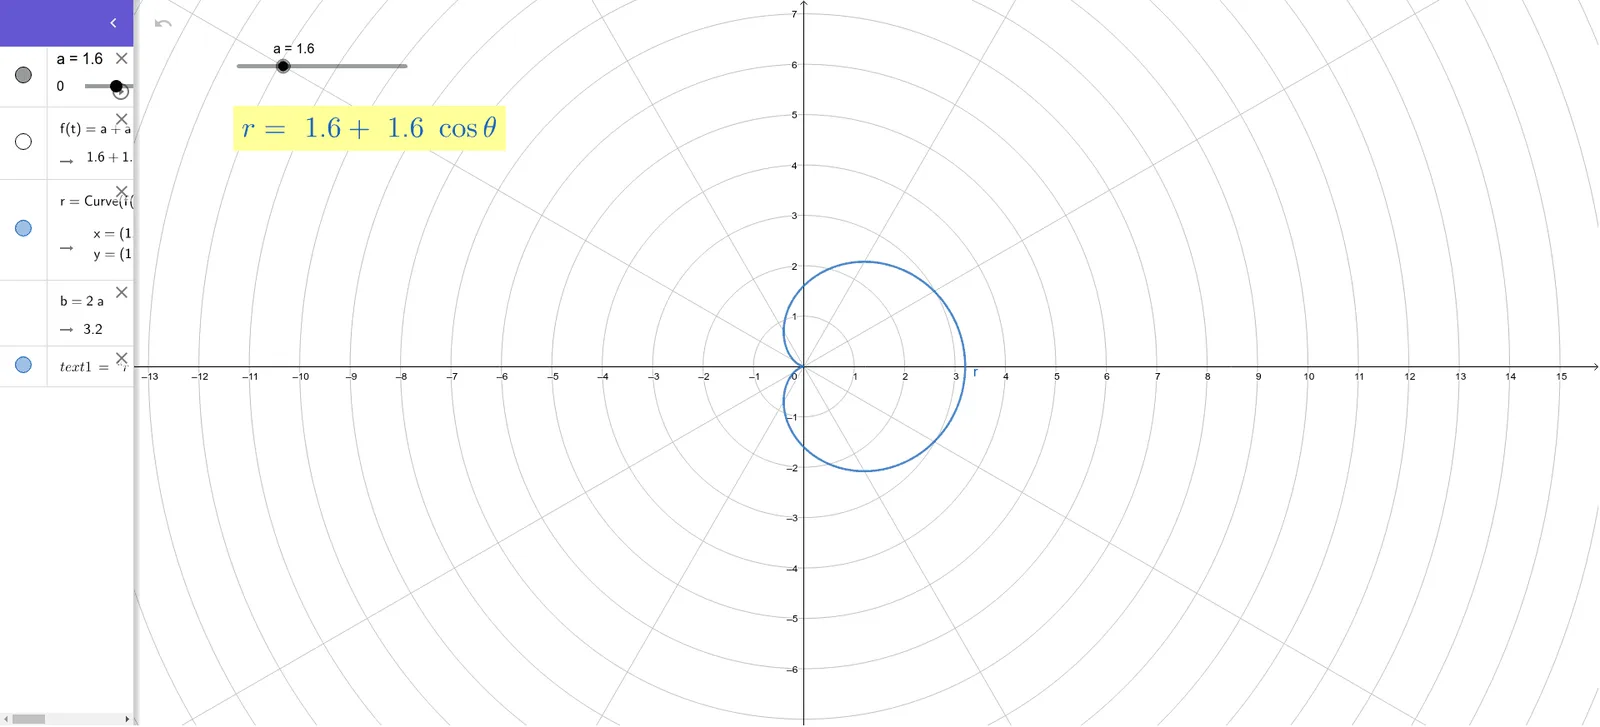
This example demonstrates the generation of complex polar coordinate graphs integrating pyramid and triangle structures. Key mathematical concepts include polar coordinate systems, trigonometric functions, special point calculations, and stochastic process simulations. The construction uses GeoGebra's CurveCartesian command for plotting curves with parameters a, f, r, b, and text1 for annotations. Suitable for high school and above mathematics learning to understand the formation and parameter effects of polar coordinate graphs.
GeoGebra Commands & Parameters
CurveCartesian((f(t) * cos(t)), (f(t) * sin(t)), t, 0, (2 * π)) → r
AI Drawing Prompt Reference
Draw a polar coordinate graph featuring a single smooth closed curve that spirals around the origin, blending pyramid and triangular shapes. The curve starts at angle 0 and ends at 2π, with its radius varying according to trigonometric functions and parameters. Include a text annotation indicating the values or roles of parameters a, f, r, and b. The graph is symmetric and periodic, suitable for studying how parameters affect polar curves.
The prompt above was compiled from the original drawing commands and is for reference only.