
Polar Graphs - 6
Loading the math board and drawing, please wait…
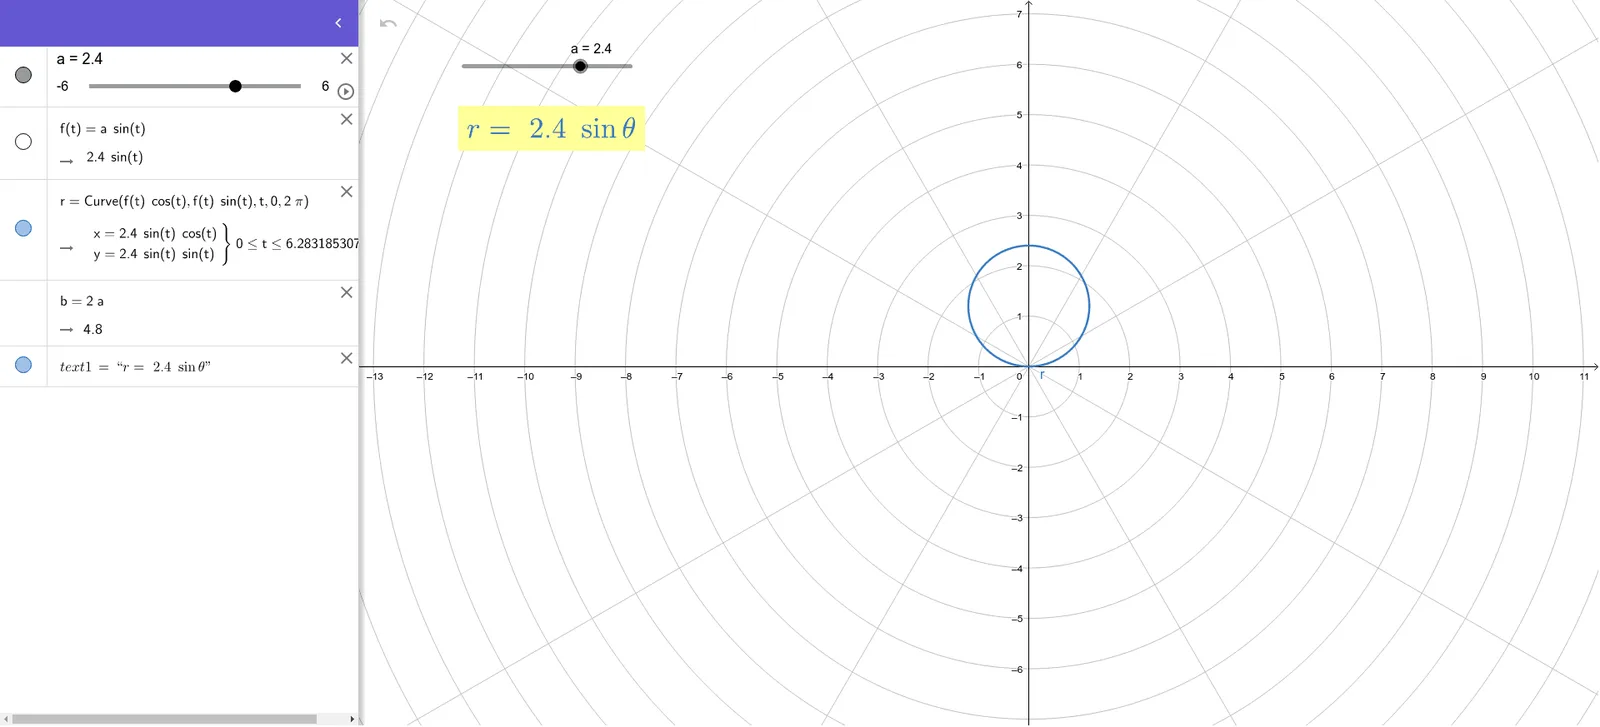
This example demonstrates the method of drawing polar graphs. It involves the core mathematical concept of curve equations in the polar coordinate system. Using the CurveCartesian command, a polar curve defined by given parameters can be plotted. Suitable for high school mathematics education and learning.
GeoGebra Commands & Parameters
CurveCartesian((f(t) * cos(t)), (f(t) * sin(t)), t, 0, (2 * π)) → r
AI Drawing Prompt Reference
Draw a spiral polar graph with radius f(t), where t ranges from 0 to 2π. First define f(t), then use the CurveCartesian command to plot the graph.
The prompt above was compiled from the original drawing commands and is for reference only.