
Polar Curve Graphing by Przemysław Kajetanowicz
Loading the math board and drawing, please wait…
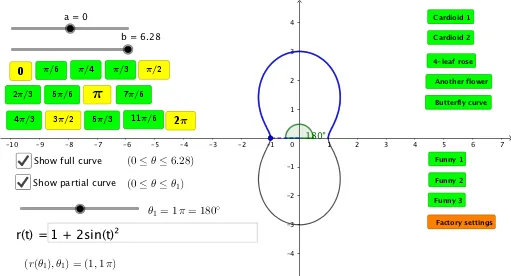
This example demonstrates how to graph polar curves. Key mathematical concepts include polar coordinates and parametric equations. It uses commands like CurveCartesian, Textfield, Angle, and Segment in GeoGebra. Suitable for high school math education and learning.
GeoGebra Commands & Parameters
CurveCartesian(f(t), g(t), t, a, b) → myCurveTextfield(r) → InputBox1CurveCartesian((r(t) * cos(t)), (r(t) * sin(t)), t, a, tt) → partialCurveAngle((1, 0), (0, 0), P) → αSegment((0, 0), P) → radiusSegment((0, 0), A) → h
AI Drawing Prompt Reference
Draw a polar curve using the function r(t) from the input box as the radius, with t as the parameter. First, draw the full polar curve, then draw a partial curve, mark the angle α as the angle between point P and the positive x-axis, and draw a radius segment from the origin to point P, finally draw a segment h from the origin to point A.
The prompt above was compiled from the original drawing commands and is for reference only.