
Polar Coordinates Function Demo
Loading the math board and drawing, please wait…
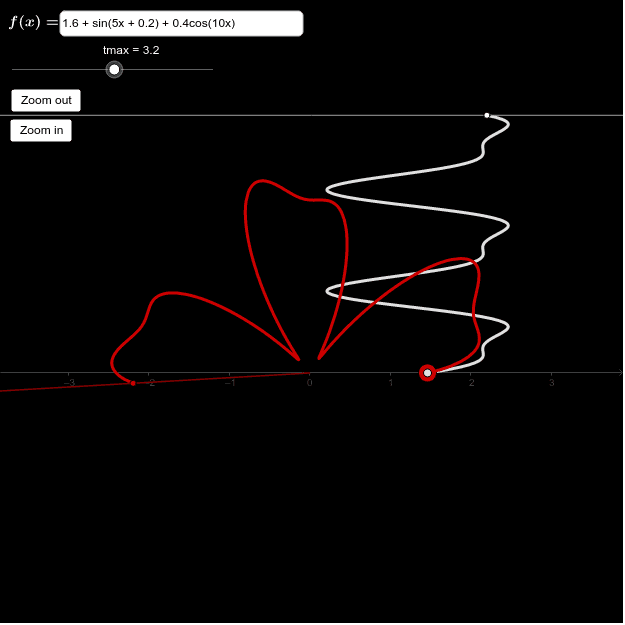
This example demonstrates how to plot polar coordinate curves by entering a function in terms of x. It involves core math concepts like polar coordinate systems, function graphs, symmetry, angles, and straight lines. Key GeoGebra commands/objects used include CurveCartesian for Cartesian plotting, Textfield for input, Ray, Line, and Segment for geometric constructions. Suitable for high school mathematics teaching to understand function representations and transformation patterns in polar coordinates.
GeoGebra Commands & Parameters
CurveCartesian(f(tmax - t), t, t, 0, tmax) → c1CurveCartesian((f(tmax - t) * cos(t)), (f(tmax - t) * sin(t)), t, 0, tmax) → c2Textfield(f) → inputBox1Ray((0, 0), B) → rLine(C, xAxis) → aSegment((0, 0), B) → b
AI Drawing Prompt Reference
Plot a polar coordinate curve by inputting a function, showing symmetry, angles, and straight lines, including the conversion from Cartesian to polar coordinates, start with rays and line segments, then draw function curves and geometric constructions, finally label the function expression.
The prompt above was compiled from the original drawing commands and is for reference only.