
Polar Coordinates by Ken Schwartz
Loading the math board and drawing, please wait…
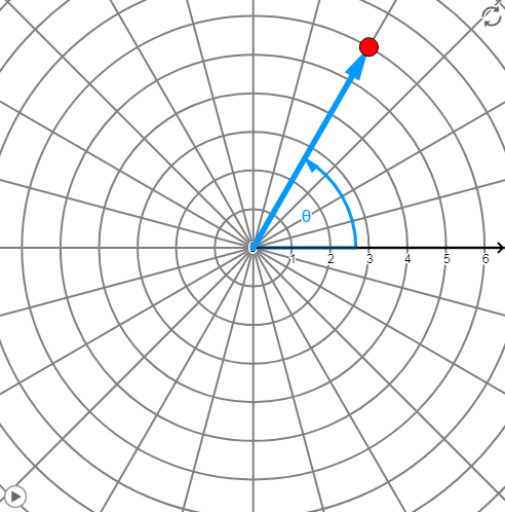
This example demonstrates points and curves in the polar coordinate system, where points are represented by distance and angle. Various curves, such as rose curves, can be drawn by adjusting the angle and radius. Commands like Vector, CurveCartesian, Line, and Angle are used. Suitable for high school mathematics education and learning.
GeoGebra Commands & Parameters
Vector((0, 0), ((r * cos(θ)), (r * sin(θ)))) → rvecCurveCartesian((cos(t) * f(t)), (sin(t) * f(t)), t, 0, (2 * π)) → r1Line(P, (0, 0)) → AngleLineVector((0, 0), (100, 0)) → XvecAngle(Xvec, Vector[If[r > 0, rvec, ((-x(P)), (-y(P)))]]) → PolarAngleAngle(Vector[((-x(P)), (-y(P)))], Vector[P]) → RNegAngle
AI Drawing Prompt Reference
Draw a polar coordinate system graph, including a rose curve. Start by drawing the origin, then draw a vector from the origin to represent a point in polar coordinates. Next, draw a rose curve by adjusting the angle and radius. Finally, draw the X-axis vector and an angle line to indicate the angle in the polar coordinate system.
The prompt above was compiled from the original drawing commands and is for reference only.