
Polar Coordinates by Hatchtag Resources
Loading the math board and drawing, please wait…
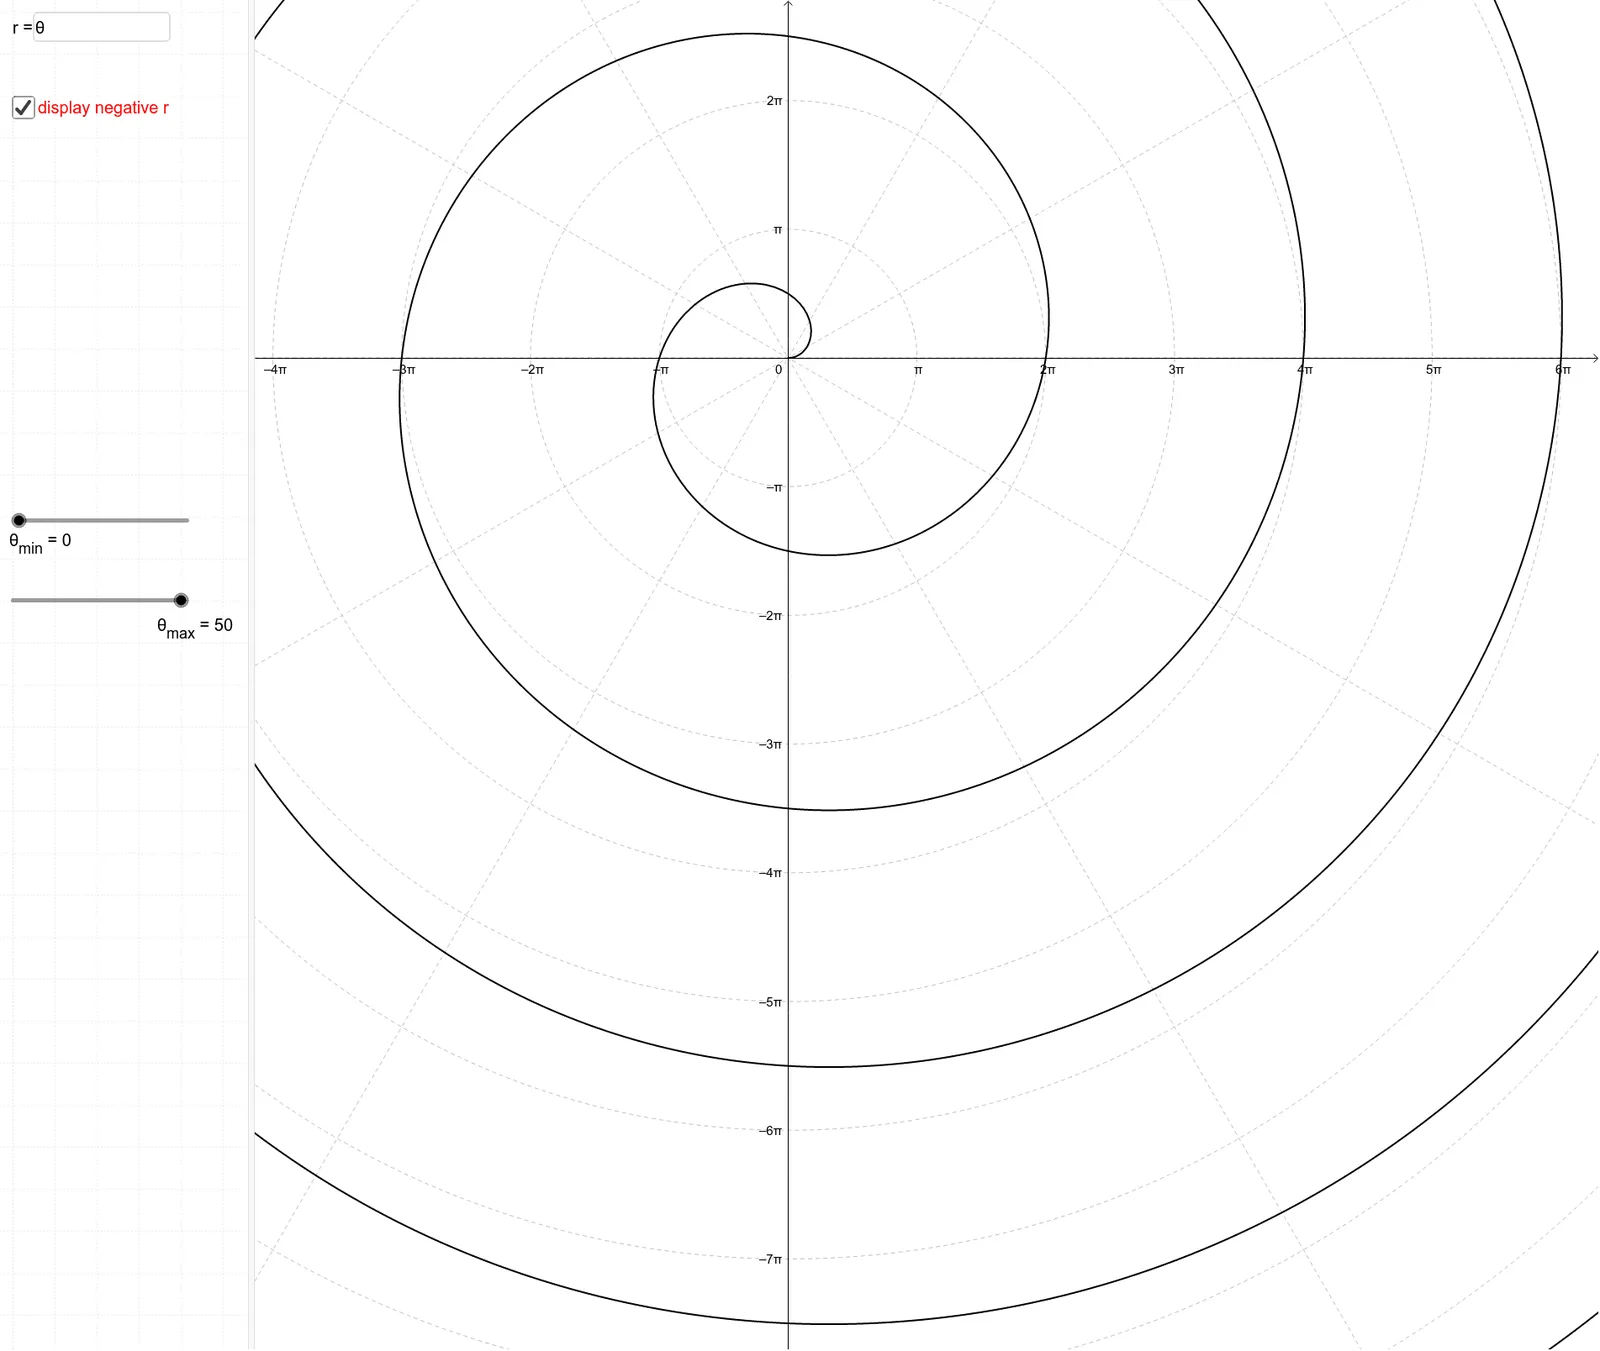
This example demonstrates how to plot functions using polar coordinates and illustrates their symmetry. Key math concepts include polar coordinate systems, function graphs, symmetry, and trigonometric functions. Construction highlights involve using Textfield for input boxes, CurveCartesian for plotting polar curves, and objects like r, f, g, h, inputBox1, θ_{max}, θ_{min}, b, a, c for parameter control and graph generation. Suitable for high school mathematics education to understand polar coordinate applications and function graphing.
GeoGebra Commands & Parameters
Textfield(r) → inputBox1CurveCartesian((h(θ) * cos(θ)), (h(θ) * sin(θ)), θ, θ_{min}, θ_{max}) → bCurveCartesian((g(θ) * cos(θ)), (g(θ) * sin(θ)), θ, θ_{min}, θ_{max}) → a
AI Drawing Prompt Reference
Draw two polar curves defined by functions h(θ) and g(θ) over a θ range from θ_min to θ_max, with input boxes for parameters r, f, g, h, θ_min, θ_max and sliders for a, b, c to control the shapes, showing the symmetry of the graphs. The curves are plotted in Cartesian coordinates using the conversion x = r cos θ, y = r sin θ, and update dynamically as the user changes any parameter.
The prompt above was compiled from the original drawing commands and is for reference only.