
Poisson Distribution Probability Calculation
Loading the math board and drawing, please wait…
In collections
Learn GeoGebra Classic
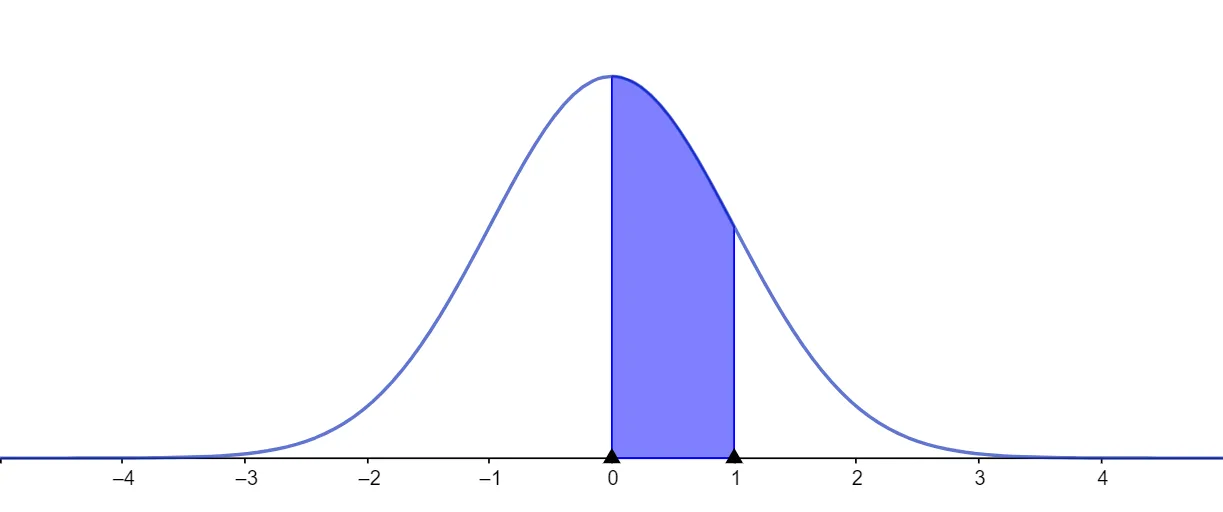
This example demonstrates how to calculate probabilities of a Poisson distribution. It visually shows the probability mass function of the Poisson distribution, allowing users to intuitively understand the effect of parameter λ on the distribution shape. The core mathematical concepts involved are the Poisson distribution and its probability calculation in probability and statistics. Key construction points include plotting the probability mass function, dynamically adjusting parameter λ to observe distribution changes, utilizing GeoGebra's function graphing, slider animation, and calculation commands. Suitable for high school and above students learning probability and statistics, or as an auxiliary teaching tool for introductory statistics.
AI Drawing Prompt Reference
Create a visual representation of Poisson distribution probability calculation, featuring a probability mass function graph that dynamically adjusts its shape as parameter λ is changed, providing an intuitive understanding of the parameter's effect on the distribution, suitable for high school and above students learning probability and statistics.
The prompt above was compiled from the original drawing commands and is for reference only.