
Poisson Distribution Graph
Loading the math board and drawing, please wait…
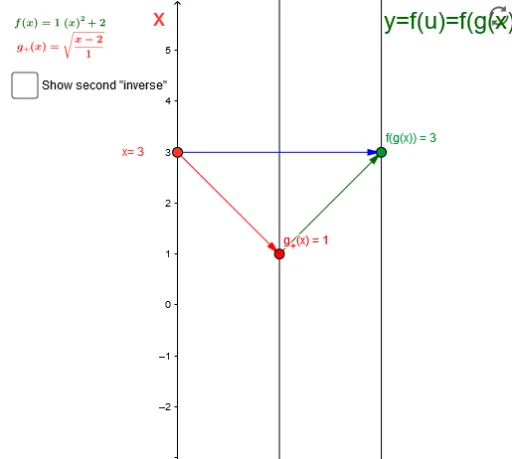
This example demonstrates the distribution graph of a random variable, particularly the Poisson distribution. It uses GeoGebra commands such as points, vectors, and text fields to construct scatter plots and function graphs, illustrating important concepts in probability and statistics. Suitable for high school probability and statistics courses.
GeoGebra Commands & Parameters
Point(yAxis) → A_1Vector(A_1, B_1) → uVector(B_1, C_1) → vTextfield(g_+) → inputBox1Textfield(f) → inputBoxfVector(A_1, C_1) → wPoint(g_+) → DVector(A_1, B_2) → dVector(B_2, C_1) → e
AI Drawing Prompt Reference
Draw a Poisson distribution graph. Start by creating a point on the y-axis, then draw vectors u and v from this point. Input λ in inputBox1, and use it to define the Poisson distribution function f(x) = (e^(-λ) * λ^x) / x! in inputBoxf. Finally, plot the graph of this function on the x-axis.
The prompt above was compiled from the original drawing commands and is for reference only.