
Point-Slope Form of a Linear Function: Defined by Two Points
Loading the math board and drawing, please wait…
In collections
TFM: Introducción al Cálculo Infinitesimal (1º Bachillerato)
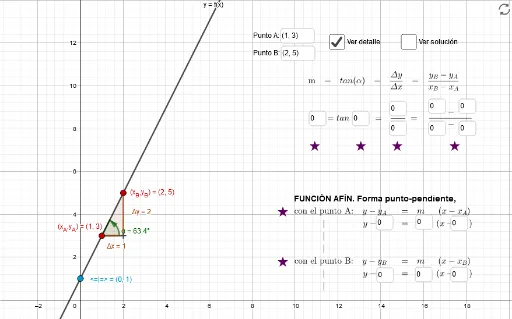
This GeoGebra example demonstrates how to define a linear function (affine function) using two draggable points, and dynamically displays its point-slope equation. The core mathematical concept is the point-slope form of a linear equation, where a line is determined by a point and its slope, involving slope, intercept, coordinate differences (Δx, Δy), and the angle of inclination. Construction highlights: the Line command creates the straight line, Point commands generate movable points A and B, Segment connects them to visualize Δx and Δy, Angle marks the inclination angle α, and Textfield shows the dynamic equation and slope value. Commands like GetSlope, GetExprASlope, and GetExprBSlope extract expressions for display. Suitable for middle and high school students learning linear functions, line equations, and slope concepts, as well as for classroom demonstrations or self-exploration—dragging the points reveals how the slope and equation change in real time.
GeoGebra Commands & Parameters
Line(A, B) → fPoint(f) → CPoint(yAxis) → OYPoint(xAxis) → OXSegment(O, OY) → gSegment(O, OX) → hLine(B, g) → iLine(A, h) → jIntersect(i, j) → DPolygon(A, D, B) → t1, b, a, dAngle(b, f) → αIntersect(xAxis, yAxis) → ETextfield(A) → A_{e}ntradaTextfield(B) → TypePuntoBTextfield(GetInYB) → TestYBTextfield(GetInYA) → TestYATextfield(GetInXB) → TestXBTextfield(GetInXA) → TestXATextfield(GetIncY) → TestIncYTextfield(GetIncX) → TestIncXTextfield(GetAngle) → TestAngleTextfield(GetSlope) → TestSlopeTextfield(GetExprACoordY) → TypeYATextfield(GetExprASlope) → TypeMATextfield(GetExprACoordX) → TypeXATextfield(GetExprBCoordY) → TypeYBTextfield(GetExprBSlope) → TypeMBTextfield(GetExprBCoordX) → TypeXB
AI Drawing Prompt Reference
Draw a coordinate plane with two perpendicular axes. Place two draggable points on the plane and connect them with a straight line, representing a linear function. From the origin, draw perpendicular segments to each axis, and through the two points draw auxiliary lines parallel to the axes, intersecting the perpendicular segments to form a right triangle, with the right-angle vertex at the intersection of the auxiliary lines. Mark the acute angle adjacent to the line as the inclination angle. Next to the figure, display several text boxes showing the coordinates of the two points, the coordinate differences, the inclination angle, and the slope value, all updating dynamically.
The prompt above was compiled from the original drawing commands and is for reference only.