
Plotting Graphs of Linear Equations in 2 Unknowns
Loading the math board and drawing, please wait…
In collections
Graphs of Linear Equations in Two Unknowns
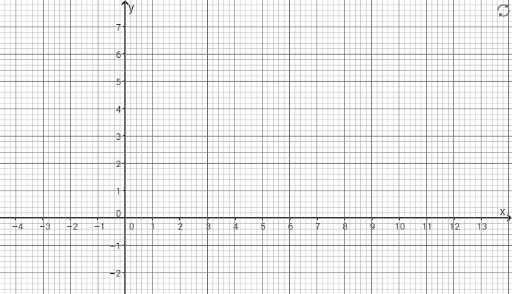
This example demonstrates how to plot the graphs of linear equations in two unknowns on a 2D coordinate plane. By plotting the intersection point of two lines, the solution to the system of linear equations can be visually understood. Key mathematical concepts include linear equations, slope-intercept form of lines, and coordinate geometry. The construction utilizes GeoGebra commands such as Sequence, along with objects like S, T, U, V, int, list1, list2, list3, list4, B1, A1. It is suitable for middle school students and above learning linear equations and analytical geometry, as well as for classroom demonstrations.
GeoGebra Commands & Parameters
Sequence(Segment[(x(S) + (int * i), y(S)), (x(T) + (int * i), y(T))], i, 0, (x(U) - x(T)) / int) → list1Sequence(Segment[(x(T), y(T) + (int * i)), (x(U), y(U) + (int * i))], i, 0, (y(S) - y(T)) / int) → list2Sequence(Segment[(x(S) + (int * i / 5), y(S)), (x(T) + (int * i / 5), y(T))], i, 0, (5 * (x(U) - x(T)) / int)) → list3Sequence(Segment[(x(T), y(T) + (int * i / 5)), (x(U), y(U) + (int * i / 5))], i, 0, (5 * (y(S) - y(T)) / int)) → list4
AI Drawing Prompt Reference
Plot two lines with equations y = 2x + 1 and y = -x + 4. First, plot the line y = 2x + 1, then plot the line y = -x + 4. Find the intersection point of these two lines, which is the solution to the system of equations. Finally, draw auxiliary lines to help understand the slope and y-intercept of the lines.
The prompt above was compiled from the original drawing commands and is for reference only.