
Plant Height Over Time: Linear Function Graph and Data Points
Loading the math board and drawing, please wait…
In collections
CCGPS CA Unit 4 Lesson 2
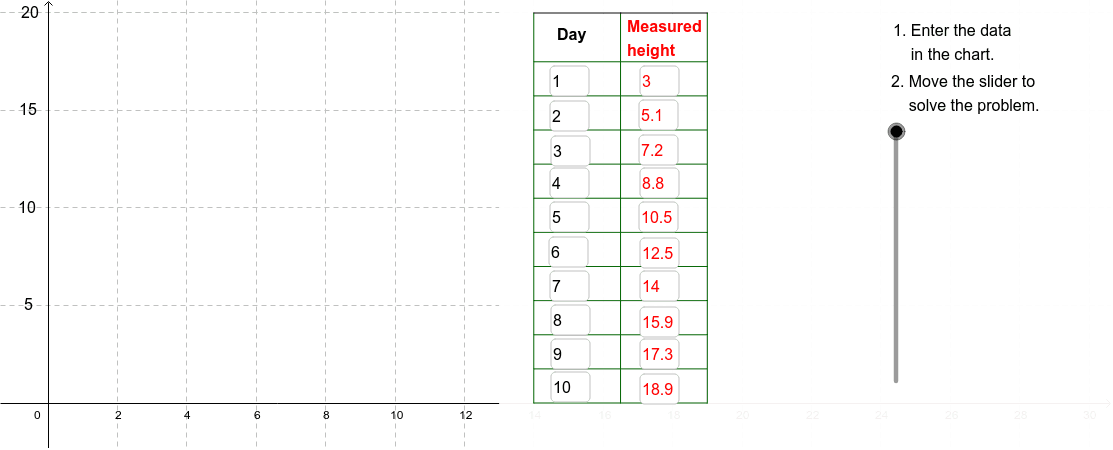
This example demonstrates how Pablo's daily plant-height measurements over 10 days can be modeled as a linear function graph, showing the relationship between time and height. It covers linear functions, coordinate points, slope and intercept, data plotting, and function graphing. In GeoGebra, it uses Sequence to generate point/object lists such as A1-A11, B1-B11, C1-C11, and D1-D7, Textfield for labels or inputs, Segment to connect points or draw line segments, and Polygon to create a polygonal region or frame. It is suitable for middle-school and high-school algebra, science data modeling, and CCGPS CA 4.2.3 instruction.
GeoGebra Commands & Parameters
Sequence(Segment[(11.5, (5 * i)), (12.5, (5 * i))], i, 1, 4) → TickListTextfield(A2) → InA2Textfield(A3) → InA3Textfield(A4) → InA4Textfield(A5) → InA5Textfield(A6) → InA6Textfield(A7) → InA7Textfield(A8) → InA8Textfield(A9) → InA9Textfield(A10) → InA10Textfield(A11) → InA11Textfield(B2) → InB2Textfield(B3) → InB3Textfield(B4) → InB4Textfield(B5) → InB5Textfield(B6) → InB6Textfield(B7) → InB7Textfield(B8) → InB8Textfield(B9) → InB9Textfield(B10) → InB10Textfield(B11) → InB11Sequence(Segment[(14, 0 + (1.75 * i)), (19, 0 + (1.75 * i))], i, 0, 10) → CrossList1Sequence(Segment[(19, 0 + (1.75 * i)), (21.5, 0 + (1.75 * i))], i, 0, 10) → CrossList2Sequence(Segment[(21.5, 0 + (1.75 * i)), (24, 0 + (1.75 * i))], i, 0, 10) → CrossList3Sequence(Segment[(14 + (2.5 * i), 0), (14 + (2.5 * i), 20)], i, 0, 2) → SideList1Segment((14, 20), (19, 20)) → Top1Segment((19, 20), (21.5, 20)) → Top2Segment((21.5, 20), (24, 20)) → Top3Segment((21.5, 0), (21.5, 20)) → Side2Segment((24, 0), (24, 20)) → Side3Polygon((13, y(Corner[1])), Corner[2], Corner[3], (13, y(Corner[4]))) → poly1, b, c, d, eSegment((0, 10), (13, 10)) → ResidualAxis
AI Drawing Prompt Reference
Create a graph showing plant height over time as a linear function. On the left, place a data table with two columns of input fields for days (1 to 10) and corresponding heights. On the right, draw coordinate axes with time on the x-axis and height on the y-axis, plot data points and connect them with a straight line. Below the chart, add a grid area made of horizontal and vertical segments to represent residuals or auxiliary lines, and draw a horizontal reference line at the bottom. Keep the layout clear to emphasize the linear relationship.
The prompt above was compiled from the original drawing commands and is for reference only.