
Pie Chart
Loading the math board and drawing, please wait…
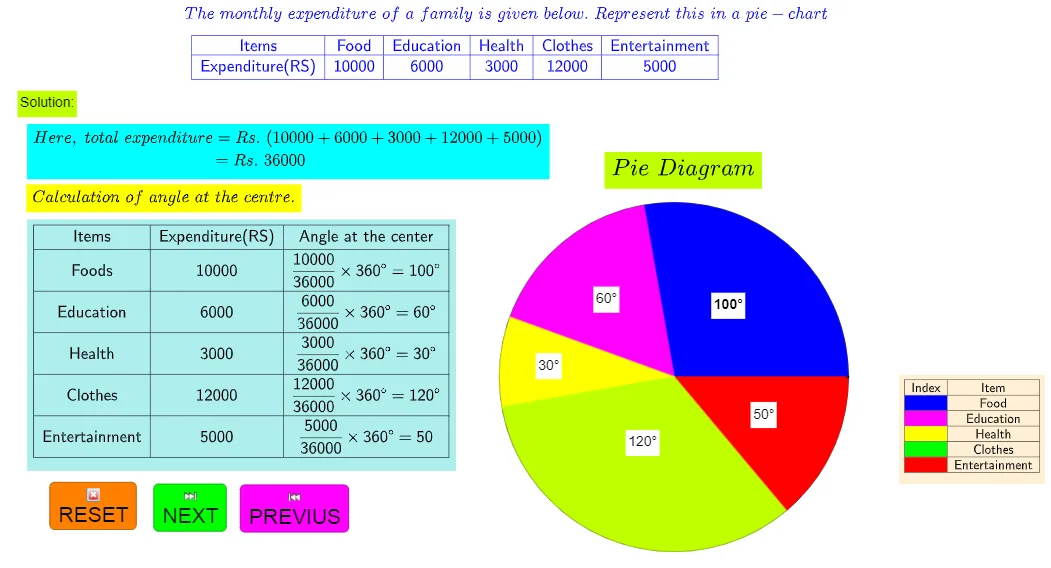
This example demonstrates how to construct a pie chart using GeoGebra commands such as Intersect, Point, Circle, Rotate, etc. A pie chart is a statistical chart used to show the proportion of different categories. The core mathematical concepts involved include angles, circles, and statistics. Suitable for students at the junior high school level and above to learn data visualization and statistical analysis.
GeoGebra Commands & Parameters
Intersect(xAxis, yAxis) → APoint(xAxis) → BCircle(A, B) → hRotate(B, (a * g°), A) → B'Angle(B, A, B') → αRotate(B', (b * g°), A) → B''Angle(B', A, B'') → βRotate(B'', (c * g°), A) → B'''Angle(B'', A, B''') → γRotate(B''', (d * g°), A) → CAngle(B''', A, C) → δCircleSector(A, B, B') → kCircleSector(A, C, B) → pCircleSector(A, B', B'') → qCircleSector(A, B'', B''') → rCircleSector(A, B''', C) → sTableText({{A1, A2, A3, A4, A5, A6}, {C1, C2, C3, C4, C5, C6}}, "|_cccccc") → text1TableText({{A7, B7}, {A8, B8}, {A9, B9}, {A10, B10}, {A11, B11}, {A12, B12}}, "|_cc") → text7Textfield(w) → InputBox1TableText({{If[w > 4, ("" * B1), ""], If[w > 5, ("" * C1), ""], If[w > 6, ("" * D1), ""]}, {If[w > 7, ("" * B2), ""], If[w > 8, ("" * C2), ""], If[w > 9, ("" * D2), ""]}, {If[w > 10, ("" * B3), ""], If[w > 11, ("" * C3), ""], If[w > 12, ("" * D3), ""]}, {If[w > 13, ("" * B4), ""], If[w > 14, ("" * C4), ""], If[w > 15, ("" * D4), ""]}, {If[w > 16, ("" * B5), ""], If[w > 17, ("" * C5), ""], If[w > 18, ("" * D5), ""]}, {If[w > 19, ("" * B6), ""], If[w > 20, ("" * C6), ""], If[w > 21, ("" * D6), ""]}}, "|_ccc") → text2Textfield(a) → InputBox2Textfield(b) → InputBox3Textfield(c) → InputBox4Textfield(d) → InputBox5Textfield(e) → InputBox6