
Pie Chart and Quadratic Function Interaction Demo
Loading the math board and drawing, please wait…
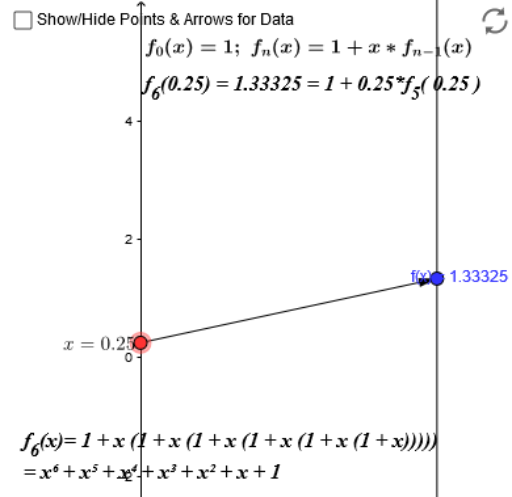
This example demonstrates the interaction between pie charts (circle charts) and quadratic functions, visually showing the relationship between data distribution and function graphs. Core math concepts include pie charts, quadratic functions, roots, integers, and standard deviation. Construction highlights from the summary involve GeoGebra commands/objects like Point, Expand, Vector, and Sequence. Suitable for high school mathematics education, focusing on the integration of data visualization and function properties.
GeoGebra Commands & Parameters
Point(yAxis) → AExpand(h) → fVector(A, B) → uSequence(Vector[(0, x(Element[list1, j])), (1, y(Element[list1, j]))], j, 1, 13) → list2