
Phasor Addition of Waveforms
Loading the math board and drawing, please wait…
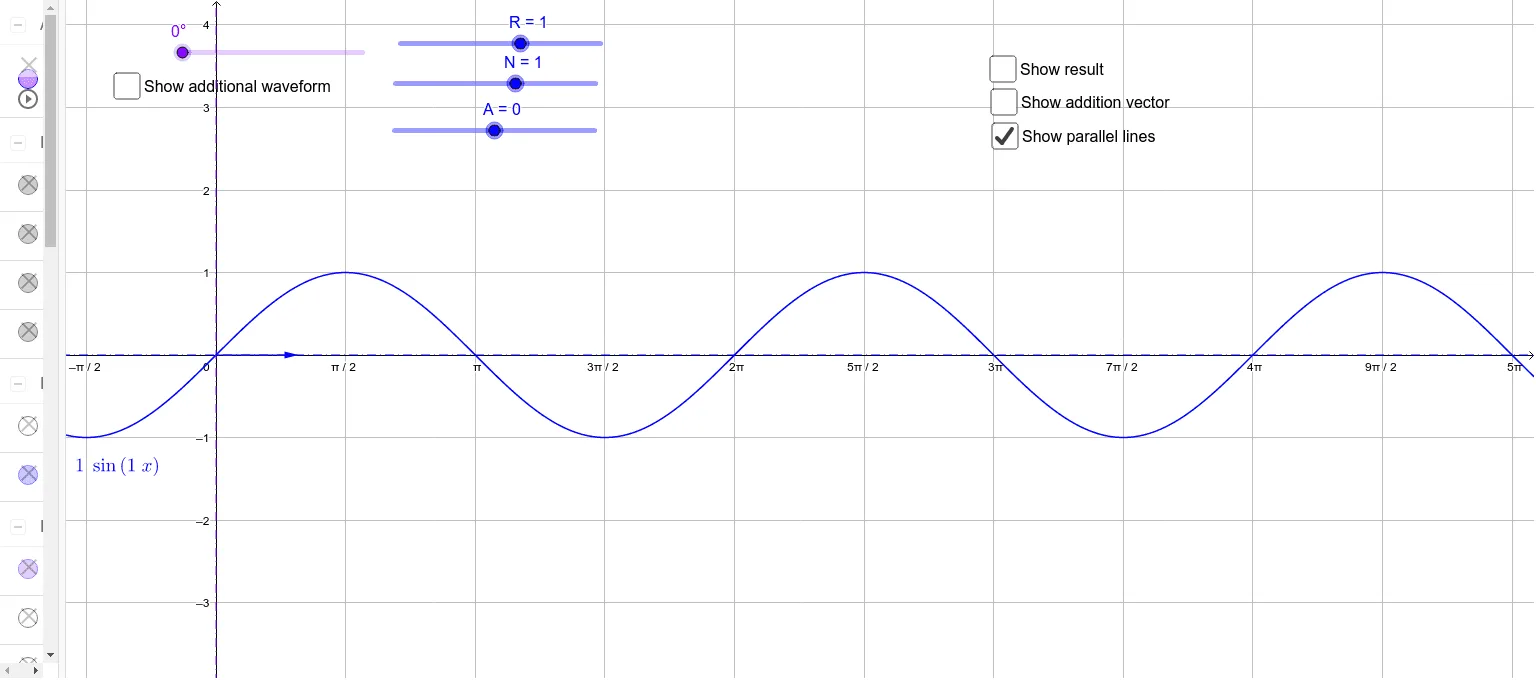
This example demonstrates the phasor addition of waveforms, visually illustrating the geometric meaning of waveform superposition. Key math concepts include vectors, complex numbers, trigonometry, and coordinate geometry. Construction highlights from the summary involve commands like Line, Intersect, and Vector in GeoGebra. Suitable for high school students and professionals in fields requiring signal processing or circuit analysis.
GeoGebra Commands & Parameters
Line(C, yAxis) → hIntersect(xAxis, yAxis) → DVector(D, B) → uVector(D, F) → vVector(B, E) → wVector(D, E) → resultLine(G, xAxis) → iLine(B, xAxis) → jLine(F, xAxis) → l
AI Drawing Prompt Reference
Draw a coordinate plane with the origin marked. From the origin, draw two vectors representing two waveforms. From the endpoint of the first vector, draw another vector representing the phase shift of the second waveform relative to the first. Then, from the origin, draw a vector pointing to the final resultant point, which is determined by placing the second vector's tail at the first vector's head. At the resultant point, draw a horizontal line, and also draw horizontal lines at the endpoints of the two original vectors. These horizontal lines illustrate the vertical projections of each waveform. Ensure all vectors and horizontal lines are clearly visible to demonstrate the geometric meaning of waveform superposition.
The prompt above was compiled from the original drawing commands and is for reference only.