
Phasor Addition of Waveforms by sian.mat
Loading the math board and drawing, please wait…
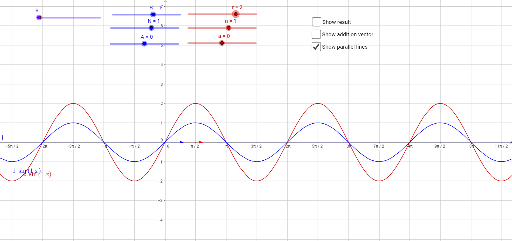
① This example demonstrates the phasor (vector) addition of several sinusoidal waveforms, showing the resulting amplitude and phase graphically. ② Core mathematical concepts include vector addition, trigonometric representation of sinusoids, complex‑number/phasor modeling, and the geometric meaning of magnitude and phase angle. ③ Construction highlights: GeoGebra commands Line, Intersect, and Vector create reference lines, intersection points, and phasor vectors; objects r, n, a, f, R, N, A, g, θ, B, C, h, D, u, E, F, v, w, result, G, i, b, j, l, c, d represent individual phasors, angles, intermediate points, and the final resultant vector. ④ Suitable for high‑school physics/math electives, introductory university signals and systems courses, and as an interactive teaching aid for phasor analysis.
GeoGebra Commands & Parameters
Line(C, yAxis) → hIntersect(xAxis, yAxis) → DVector(D, B) → uVector(D, F) → vVector(B, E) → wVector(D, E) → resultLine(G, xAxis) → iLine(B, xAxis) → jLine(F, xAxis) → l
AI Drawing Prompt Reference
Draw a graph showing the addition of multiple sinusoidal waveforms. Use vectors to represent each waveform, highlighting their amplitude and phase. Include reference lines, intersection points, and the resultant vector. Ensure the graph clearly illustrates the geometric meaning of vector addition.
The prompt above was compiled from the original drawing commands and is for reference only.