
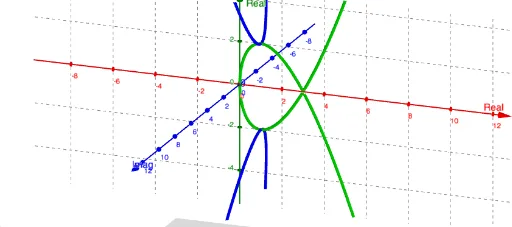
Phantom Graph y^2=x(x-3)^2 Example
Loading the math board and drawing, please wait…
In collections
Phantom Graphs
This example demonstrates how to plot and analyze the Phantom Graph represented by the equation y^2=x(x-3)^2. Key math concepts include function graphs, coordinate geometry, symmetry, and the construction of parametric equations. GeoGebra commands and objects used in the construction are ComplexRoot, Plane, Surface, and CurveCartesian. Suitable for high school and above students to understand the plotting and properties of complex function graphs.
GeoGebra Commands & Parameters
ComplexRoot((x * (x - 3)^(2)) - c^(2)) → z_1, z_2, z_3Plane((0, c, 0), (1, c, 1), (1, c, -2)) → aSurface(u, v, sqrt((3 * (u - 2)^(2)) - 3), u, -25, 2, v, -25, 25) → eSurface(u, v, (-sqrt((3 * (u - 2)^(2)) - 3)), u, -25, 2, v, -25, 25) → hCurveCartesian(2 - sqrt(1 + t^(2) / 3), (-sqrt((-sqrt(1 + t^(2) / 3)^(3)) + (3 * sqrt(1 + t^(2) / 3)) + ((3 * t^(2)) * sqrt(1 + t^(2) / 3)) + 2)), t, t, -25, 25) → dCurveCartesian(2 - sqrt(1 + t^(2) / 3), sqrt((-sqrt(1 + t^(2) / 3)^(3)) + (3 * sqrt(1 + t^(2) / 3)) + ((3 * t^(2)) * sqrt(1 + t^(2) / 3)) + 2), t, t, -25, 25) → g
AI Drawing Prompt Reference
Plot the graph of the function y^2=x(x-3)^2, including its symmetry. First, find the complex roots of the equation, then draw a plane, and use surfaces to plot the upper and lower parts of the graph. Finally, use parametric equations to draw the two branches of the graph.
The prompt above was compiled from the original drawing commands and is for reference only.