
Phantom Graph for f(x)=x²: Visualizing Complex Roots via Parametric Curves
Loading the math board and drawing, please wait…
In collections
Phantom Graphs
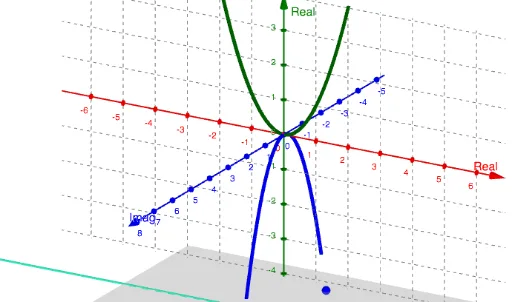
① This GeoGebra example demonstrates the 'Phantom Graph' of the quadratic function f(x)=x², extending the real graph into a complex dimension to reveal how the function behaves over complex inputs, especially showing the trajectory of complex roots as a parametric surface. ② Core mathematical concepts include complex numbers, complex roots, parametric curves, and plane equations; the phantom graph lifts the real function into 3D space where the vertical axis represents the imaginary part, making invisible complex solutions visible. ③ Construction details: the Plane command establishes a reference plane, ComplexRoot computes and displays the complex roots, and CurveCartesian generates the parametric curves; key objects include function f, curve c, graph g, point a, complex roots z_1 and z_2, auxiliary points A1/A2, parameter b, and text labels text1/text2, all combined to form an interactive phantom graph. ④ Suitable for high school to undergraduate mathematics, particularly in analytic geometry, introductory complex analysis, and function graphing, helping students grasp the connection between real functions and complex domains, as well as the power of parametric representation in visualization.
GeoGebra Commands & Parameters
Plane((0, c, 0), (1, c, 0), (0, c, 1)) → aComplexRoot(f(x) - c) → z_1, z_2CurveCartesian(0, (-t^(2)), t, t, -25, 25) → b