
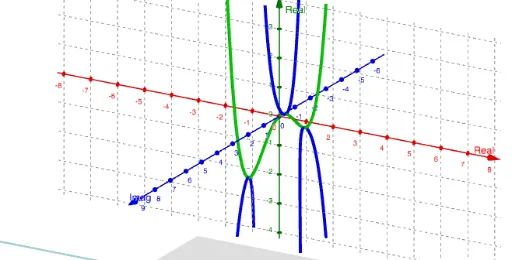
Phantom Graph Visualization of Fourth-Degree Polynomial in Complex Plane
Loading the math board and drawing, please wait…
In collections
Phantom Graphs
This GeoGebra applet demonstrates the phantom graph visualization of a fourth-degree polynomial in the complex domain. Using the ComplexRoot command to calculate four complex roots (z_1, z_2, z_3, z_4) and the CurveCartesian command to plot parametric curves on the complex plane, it vividly shows the correspondence between complex roots and function graphs. The construction involves GeoGebra commands including Plane, ComplexRoot, and CurveCartesian, along with curve objects c, g, p and multiple complex root points. Suitable for undergraduate mathematics education, this applet can be used in complex analysis, complex plane geometry, and advanced algebra courses to help students understand the relationship between polynomial root distribution and function behavior in the complex domain.
GeoGebra Commands & Parameters
Plane((0, c, 0), (1, c, 0), (0, c, 1)) → pComplexRoot(f(x) - c) → z_1, z_2, z_3, z_4CurveCartesian(t, (((-64 * A^(2)) * t^(6)) - (((32 * A) * C) * t^(4)) - ((4 * C^(2)) * t^(2)) + D^(2)) / (((16 * A) * t^(2))), sqrt(t^(2) + C / ((2 * A)) + D / (((4 * A) * t))), t, -25, 25) → aCurveCartesian(t, (((-64 * A^(2)) * t^(6)) - (((32 * A) * C) * t^(4)) - ((4 * C^(2)) * t^(2)) + D^(2)) / (((16 * A) * t^(2))), (-sqrt(t^(2) + C / ((2 * A)) + D / (((4 * A) * t)))), t, -25, 25) → b