
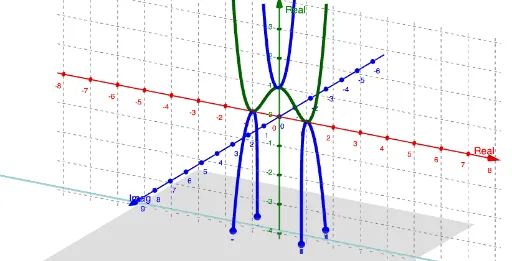
Phantom Graph of f(x)=(x²-1)(x²+1)
Loading the math board and drawing, please wait…
In collections
Phantom Graphs
This example demonstrates the phantom graph of the quartic polynomial f(x)=(x²-1)(x²+1), visualizing the relationship between the function's complex roots and its real-valued curve. The core mathematical concepts include complex numbers, complex roots of polynomials, parametric curves in the complex plane, and the extension of real functions to complex domains. Construction details: using GeoGebra commands ComplexRoot to compute the four complex roots (z_1 to z_4) and CurveCartesian to draw the parametric curve, along with objects c, g, a, f, A1-A4, text1, d, b, e, h, i, j, k to build the complete graphical representation and annotations. This resource is suitable for senior high school or early university students, helping them understand polynomial behavior over the complex field and how complex roots relate to real function graphs, and can serve as material for inquiry-based learning.
GeoGebra Commands & Parameters
ComplexRoot(f(x) - c) → z_1, z_2, z_3, z_4CurveCartesian(0, (t^(2) + 1)^(2), t, t, -25, 25) → dCurveCartesian(t, (-4 * t^(4)) + (4 * t^(2)), sqrt(t^(2) - 1), t, -25, 25) → bCurveCartesian(t, (-4 * t^(4)) + (4 * t^(2)), (-sqrt(t^(2) - 1)), t, -25, 25) → e