
Percentages: Selling Problems
Loading the math board and drawing, please wait…
In collections
PDGE Year 1: Making Use of ICT Resources
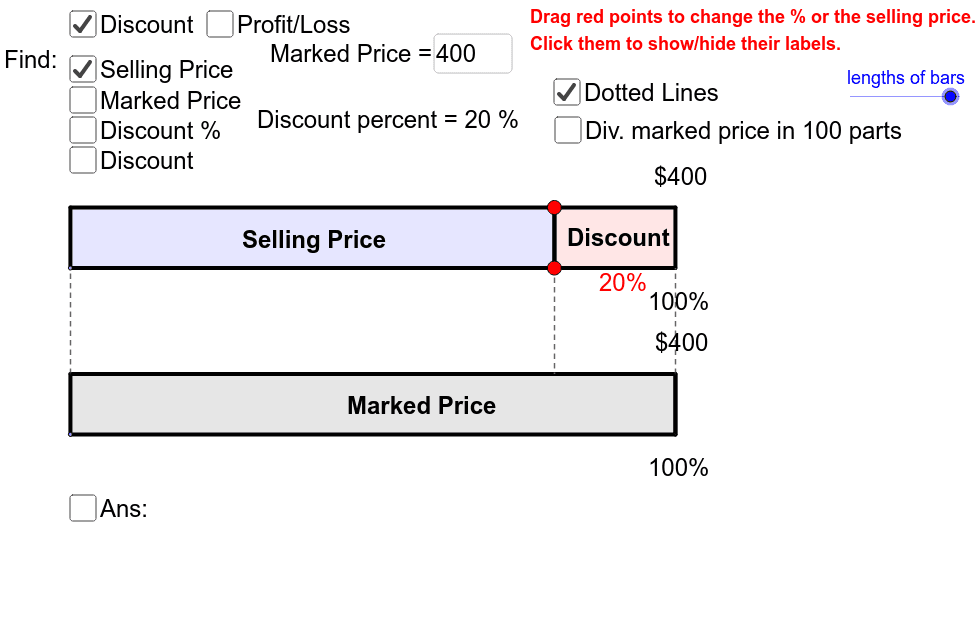
This example applies percentage changes to solve simple selling problems. It covers core math concepts such as percentage changes, cost, and profit. Using GeoGebra commands like Point, Polygon, Intersect, etc., it dynamically demonstrates changes in selling problems. Suitable for middle school and above students and teachers.
GeoGebra Commands & Parameters
Point(yAxis) → APoint(yAxis) → BPoint(Segment[A, A + (length * maxchange, 0)]) → PPoint(Segment[A + (0, width), A + (length * maxchange, width)]) → QPolygon(A, P, P + (0, width), A + (0, width)) → poly1, poly1a, poly1d, poly1b, poly1cPolygon(B, B + (length, 0), B + (length, width), B + (0, width)) → poly2, poly2b, poly2a, poly2c, poly2dIntersect(Ray[P, P + (1, 0)], x = length) → A1Intersect(Ray[Q, Q + (1, 0)], x = length) → A2Intersect(Ray[B1, B1 + (1, 0)], x = x(P)) → P'Intersect(Ray[B2, B2 + (1, 0)], x = x(P)) → Q'Polygon(P, Q, A2, A1) → poly3, poly3b, poly3b_1, poly3d, poly3cPolygon(B1, B2, Q', P') → poly4, poly4c, poly4d, poly4b, poly4aSequence(Segment[B + (i * length / 10, 0), B + (i * length / 10, width)], i, 1, 9) → list1Sequence(Sequence[Segment[B + (j * length / 100 + i * length / 10, 0), B + (j * length / 100 + i * length / 10, width)], j, 1, 9], i, 0, 9) → list2Sequence(Segment[A + (i * length / 10, 0), A + (i * length / 10, width)], i, 1, 9) → list3Sequence(Sequence[Segment[A + (j * length / 100 + i * length / 10, 0), A + (j * length / 100 + i * length / 10, width)], j, 1, 9], i, 0, 9) → list4Textfield(cost) → inputBox1Textfield(cost) → inputBox2Midpoint(B, B2) → CMidpoint(A, Q) → DMidpoint(P, A2) → EMidpoint(B1, Q') → FMidpoint(B1, Q') → GTextfield(price) → inputBox3Midpoint(P, A1) → HMidpoint(poly4a) → IMidpoint(poly3b_1) → JMidpoint(poly4d) → KIf(o_2, "$ y", "$" + cost) → text9If(o_2, "$ y", "$" + cost) → text4If(o_3, "y %", abs(change_%) * "%") → text11If(o_1, "$ y", "$" + price) → text13If(change_% < 0, "-", "+") → text24If(o_3, "y %", abs(change_%) * "%") → text17If(o_3, "1 " * text24 * " y %", "1 " + (text24 * " " * abs(change_%) * "%")) → text34If(o_3, "1 " * text24 * " y %", "1 " + (text24 * " " * abs(change_%) * "%")) → text14If(o_1 ∨ o_4, If[o_1, "$ y", cost * " " * text24 * " $ y"], "$" + price) → text12If(o_4, cost * " " * text24 * " $ y", "$" + price) → text15Textfield(price) → inputBox4Segment(B + (0, width), A) → gSegment(B2, A + (length, 0)) → iSegment(P, If[x(P) < length, Intersect[poly2c, x = x(P)], Intersect[poly4d, x = x(P)]]) → hSequence(Segment[A + (i * length / 10, 0), A + (i * length / 10, width)], i, 1, floor(x(P) / length * 10)) → list3_1Sequence(Sequence[Segment[A + (j * length / 100 + i * length / 10, 0), A + (j * length / 100 + i * length / 10, width)], j, 1, 9], i, 0, floor(x(P) / length * 10) - 1) → list4_1Sequence(Segment[B + (i * length / 10, 0), B + (i * length / 10, width)], i, 1, floor(x(P) / length * 10)) → list5Sequence(Sequence[Segment[B + (j * length / 100 + i * length / 10, 0), B + (j * length / 100 + i * length / 10, width)], j, 1, 9], i, 0, floor(x(P) / length * 10) - 1) → list6_1Sequence(Segment[A + (j * length / 100 + floor(x(P) / length * 10) * length / 10, 0), A + (j * length / 100 + floor(x(P) / length * 10) * length / 10, width)], j, 1, floor((x(P) - floor(x(P) / length * 10) * length / 10) / length * 100)) → list4_2Sequence(Segment[B + (j * length / 100 + floor(x(P) / length * 10) * length / 10, 0), B + (j * length / 100 + floor(x(P) / length * 10) * length / 10, width)], j, 1, floor((x(P) - floor(x(P) / length * 10) * length / 10) / length * 100)) → list6_2If(b ∧ (change_% < 0), "Loss", "Discount") → text8If(b, "Cost", "Marked Price") → text6
AI Drawing Prompt Reference
Draw a rectangle ABCD with A on the x-axis and B on the y-axis. Choose points P on AB and Q on BC. Draw perpendicular lines from P and Q to the x-axis, intersecting the extensions of AB at A1 and A2. Choose points B1 and B2 on BC, draw perpendicular lines from them to the x-axis, intersecting the perpendicular lines from P and Q at P' and Q'. Draw quadrilateral PQDA2 and B1Q'P', and draw a series of vertical line segments on AB and BC to represent changes in cost and price. Set input boxes for initial cost, price, and percentage change to dynamically show changes in cost and price.
The prompt above was compiled from the original drawing commands and is for reference only.