
Percentages, Prices, and Sales Geometric Analysis
Loading the math board and drawing, please wait…
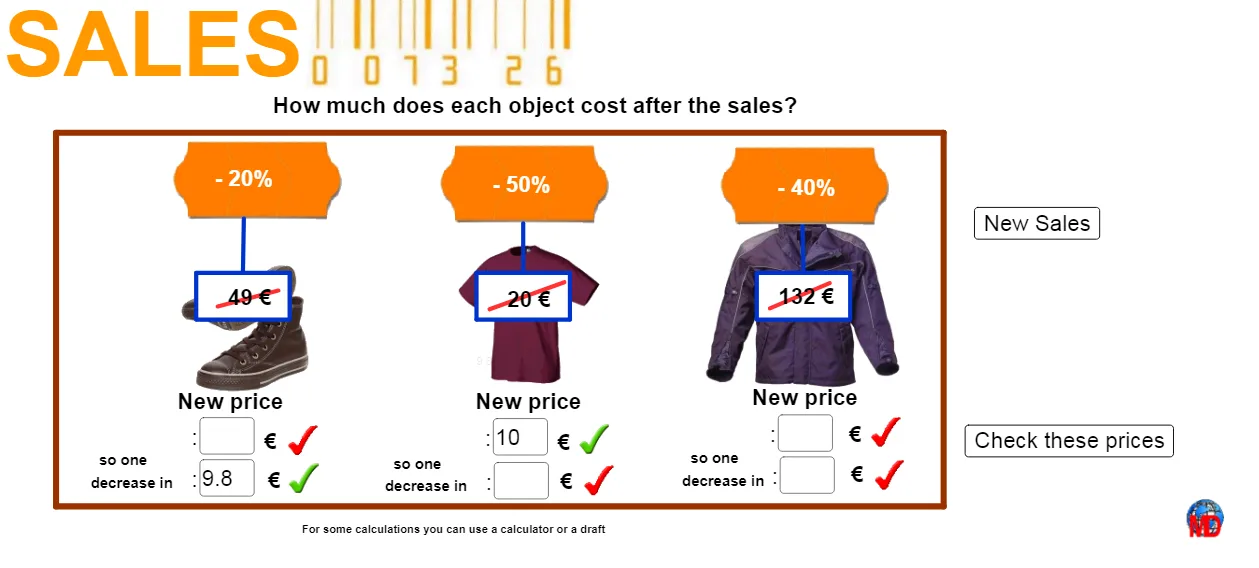
This example demonstrates the relationship between percentages, prices, and sales using geometric figures. Key mathematical concepts include geometric area calculations, ratio relationships, and function graphs. Construction involves using GeoGebra commands like Polygon, Point, Segment, and Textfield to build the diagram, with annotations for key data. Suitable for high school mathematics courses or geometric learning, helping students understand practical mathematical applications.
GeoGebra Commands & Parameters
Polygon(A, B, C, D) → poly1, a_1, b_1, c_1, d_1Polygon(E, F, G, H) → poly2, e_1, f_1, g_1, h_1Polygon(I, J, K, L) → poly3, i_1, j_1, k_1, lPoint(d_1) → MSegment(M, N) → mPoint(e_1) → OSegment(O, P) → nPoint(i_1) → QSegment(Q, R) → pSegment(S, T) → qSegment(U, V) → rSegment(W, Z) → sTextfield(Rep1) → ChampTexte1Textfield(Rep2) → ChampTexte2Textfield(Rep3) → ChampTexte3Textfield(Rep4) → ChampTexte4Textfield(Rep5) → ChampTexte5Textfield(Rep6) → ChampTexte6Polygon(A_1, B_1, C_1, D_1) → poly4, a_2, b_2, c_2, d_2
AI Drawing Prompt Reference
Draw a figure with three rectangles representing the relationship between different prices and sales. The rectangles A, B, C, D form the first rectangle, E, F, G, H form the second rectangle, and I, J, K, L form the third rectangle. Draw a line segment MN at the midpoint of the bottom side of the first rectangle, a line segment OP at the midpoint of the bottom side of the second rectangle, and a line segment QR at the midpoint of the bottom side of the third rectangle. Add annotations inside each rectangle to indicate specific price and sales values.
The prompt above was compiled from the original drawing commands and is for reference only.