
Percentage Stacked Bar Graph
Loading the math board and drawing, please wait…
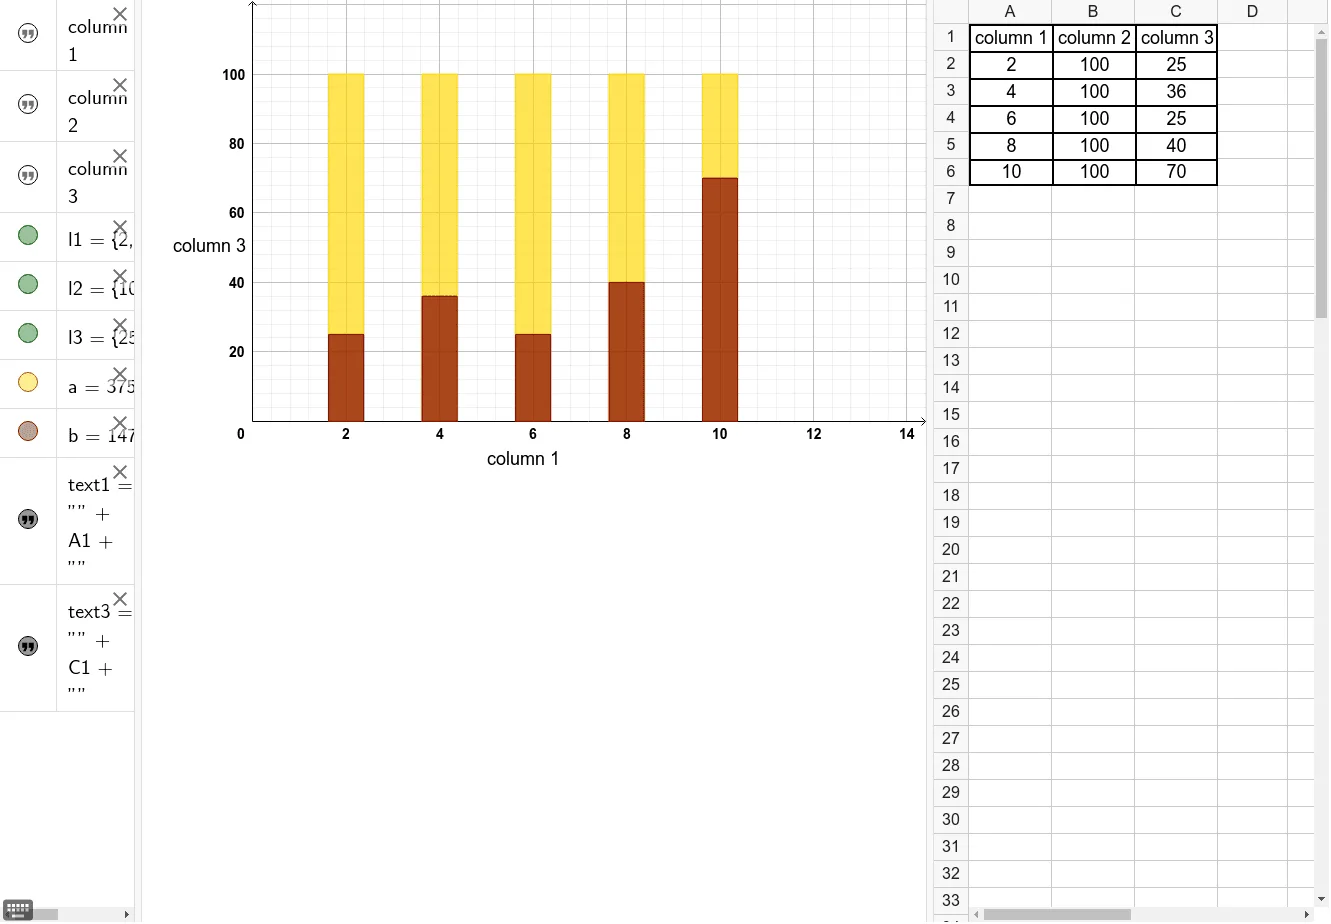
This example demonstrates how to create a percentage stacked bar graph in GeoGebra, illustrating the proportional relationships between different components. The core mathematical concepts involved include statistical data analysis, percentage calculations, and data visualization. Key construction elements from the summary include the BarChart command for generating the bar graph, data series represented by objects A1 to C6, potential auxiliary lines or labels denoted by l1 to l3, parameters a and b, and text annotations text1 and text3. It is suitable for high school mathematics courses focusing on statistics and probability, teaching data visualization and analytical methods.
GeoGebra Commands & Parameters
BarChart(l1, l2, 0.75) → aBarChart(l1, l3, 0.75) → b
AI Drawing Prompt Reference
Create a percentage stacked bar graph to illustrate proportional relationships between different components, using three auxiliary lines or labels to define data series, adjusting bar width with parameters, and adding text annotations to explain the data, suitable for high school statistics and probability courses.
The prompt above was compiled from the original drawing commands and is for reference only.