
Percentage Bar Graph: Visualizing Random Data and Statistical Characteristics
Loading the math board and drawing, please wait…
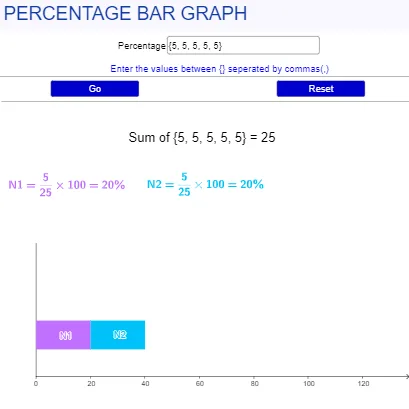
This interactive GeoGebra example demonstrates a percentage bar graph that dynamically updates based on user input, showing the proportion of each category as a percentage. It integrates core mathematical concepts such as percentage calculation, bar chart representation, random variables, and statistical characteristics like sum, maximum, and length. The construction uses GeoGebra commands including Textfield for data input, Max, Length, and Sum for statistical computations, Point and Polygon for drawing bars and a rhombus, and buttons for interactive updates. Suitable for middle school and high school students learning statistics, data visualization, and dynamic geometry, this example also serves as a template for combining statistical analysis with geometric construction in mathematics education.
GeoGebra Commands & Parameters
Textfield(l1) → InputBox1Max(l1) → aLength(l1) → bPoint(yAxis) → APoint(yAxis) → BSum(l1) → fPolygon(A + (Sum[l4, 0], 0), B + (Sum[l4, 0], 0), B + (l4(1) + Sum[l4, 0], 0), A + (l4(1) + Sum[l4, 0], 0)) → l3, l3_{2}, l3_{3}, l3_{4}, l3_{5}Polygon(A + (Sum[l4, 1], 0), B + (Sum[l4, 1], 0), B + (l4(2) + Sum[l4, 1], 0), A + (l4(2) + Sum[l4, 1], 0)) → q1, g, h, i, jPolygon(A + (Sum[l4, 2], 0), B + (Sum[l4, 2], 0), B + (l4(3) + Sum[l4, 2], 0), A + (l4(3) + Sum[l4, 2], 0)) → q2, k, l, m, nPolygon(A + (Sum[l4, 3], 0), B + (Sum[l4, 3], 0), B + (l4(4) + Sum[l4, 3], 0), A + (l4(4) + Sum[l4, 3], 0)) → q3, p, q, r, sPolygon(A + (Sum[l4, 4], 0), B + (Sum[l4, 4], 0), B + (l4(5) + Sum[l4, 4], 0), A + (l4(5) + Sum[l4, 4], 0)) → q4, t, f_1, g_1, h_1
AI Drawing Prompt Reference
Create a coordinate-plane bar chart made of several adjacent, closed bar-shaped polygons. Place two reference points on the vertical axis to serve as the left and right boundaries of the bars’ baseline, then compute the maximum value and the total sum from an editable data set. Use the cumulative sums of the data to convert each category into a percentage of the total, and build each bar as a polygon whose top boundary rises according to its percentage while the bottoms lie on the same shared baseline. Arrange the polygons consecutively from left to right so the stacked shapes form a dynamic percentage bar graph.
The prompt above was compiled from the original drawing commands and is for reference only.