
Pendulum experiment: Jackknife resampling example
Loading the math board and drawing, please wait…
In collections
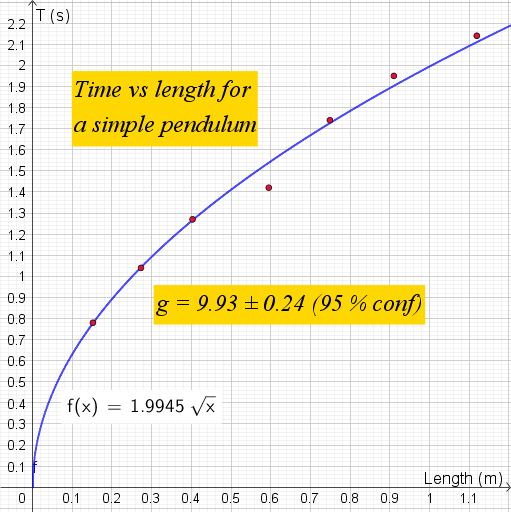
Jackknife resampling to estimate errors in fitted parameters
This example demonstrates the periodic motion of a pendulum using geometric construction. Key mathematical concepts include trigonometry, function graphing, and coordinate geometry. Construction involves using GeoGebra commands like Fit, stdev, and mean to build the pendulum model, and parametric equations to describe its motion. Suitable for high school students learning geometry and function applications, or for mathematical modeling teaching.
GeoGebra Commands & Parameters
Fit(l1, m) → fstdev(B11:B17) → B20mean(B11:B17) → B19LaTeX(f, true, true) → Text3
AI Drawing Prompt Reference
Draw a model of a pendulum's periodic motion using trigonometric functions to describe its trajectory. Start by creating a circle to represent the pendulum's swing range, then use parametric equations to draw the pendulum's swing path. Finally, calculate the mean and standard deviation of the swing data to analyze the stability of the swing.
The prompt above was compiled from the original drawing commands and is for reference only.