
PEM Statistics #3 Example
Loading the math board and drawing, please wait…
This example demonstrates interactive mathematical phenomena involving statistics, dilation, matrices, integral calculus, and 3D solids or special points. Core concepts include statistical data analysis, matrix transformations, integral calculations, 3D shape construction, and special point identification. It uses GeoGebra objects A, B, and pic1 for graphical construction and display, making it suitable for high school and above students to understand the integration and visualization of multi-domain mathematical knowledge.
GeoGebra Commands & Parameters
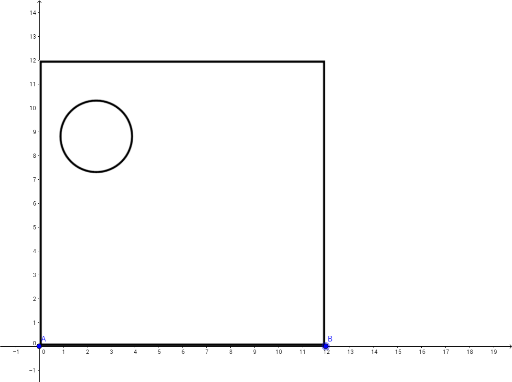
Point A(0, 0)Point B(12, 0)
AI Drawing Prompt Reference
Draw a coordinate system with two points A and B, where A is at the origin (0,0) and B is at (12,0). Use these points to demonstrate the integration and visualization of statistical data analysis, matrix transformations, integral calculations, and 3D shape construction.
The prompt above was compiled from the original drawing commands and is for reference only.