
Partial Derivative Concept Demo
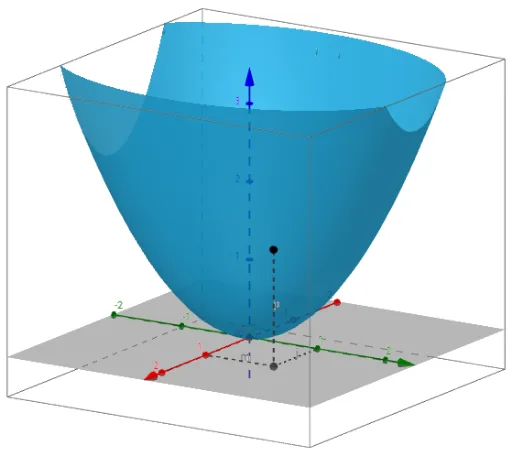
Loading the math board and drawing, please wait…
This example dynamically visualizes the geometric meaning of partial derivatives, showing the instantaneous rate of change of a function along the coordinate axes at a point. Key math concepts include partial derivatives, function graphs, and spatial geometry. Constructed using GeoGebra commands like Textfield, Derivative, Segment, Line, Plane, involving objects such as Y, X, f, InputBox1, dfx, dfy, d, i, P, XYP, p, texto1, texto2, l, h, j, m, a, b, texto3, text1, text2, making it suitable for high school students and beginners in calculus.
GeoGebra Commands & Parameters
Textfield(f) → InputBox1Derivative(f(x, y), x) → dfxDerivative(f(x, y), y) → dfySegment(P, XYP) → pLine(P, Vector[(0, 1, dfy(X, Y))]) → lLine(P, Vector[(1, 0, dfx(X, Y))]) → hSegment(XYP, (0, Y)) → jSegment(XYP, (X, 0)) → mPlane(x + (0 * z) = X) → aPlane(y + (0 * z) = Y) → b
AI Drawing Prompt Reference
Draw a contour plot of a function and show the partial derivatives along the X and Y axes at a specified point. First, plot the function, then draw tangents along the X and Y axes at that point, and finally display the partial derivative values.
The prompt above was compiled from the original drawing commands and is for reference only.