
Partial Beta Function Turbulence Art
Loading the math board and drawing, please wait…
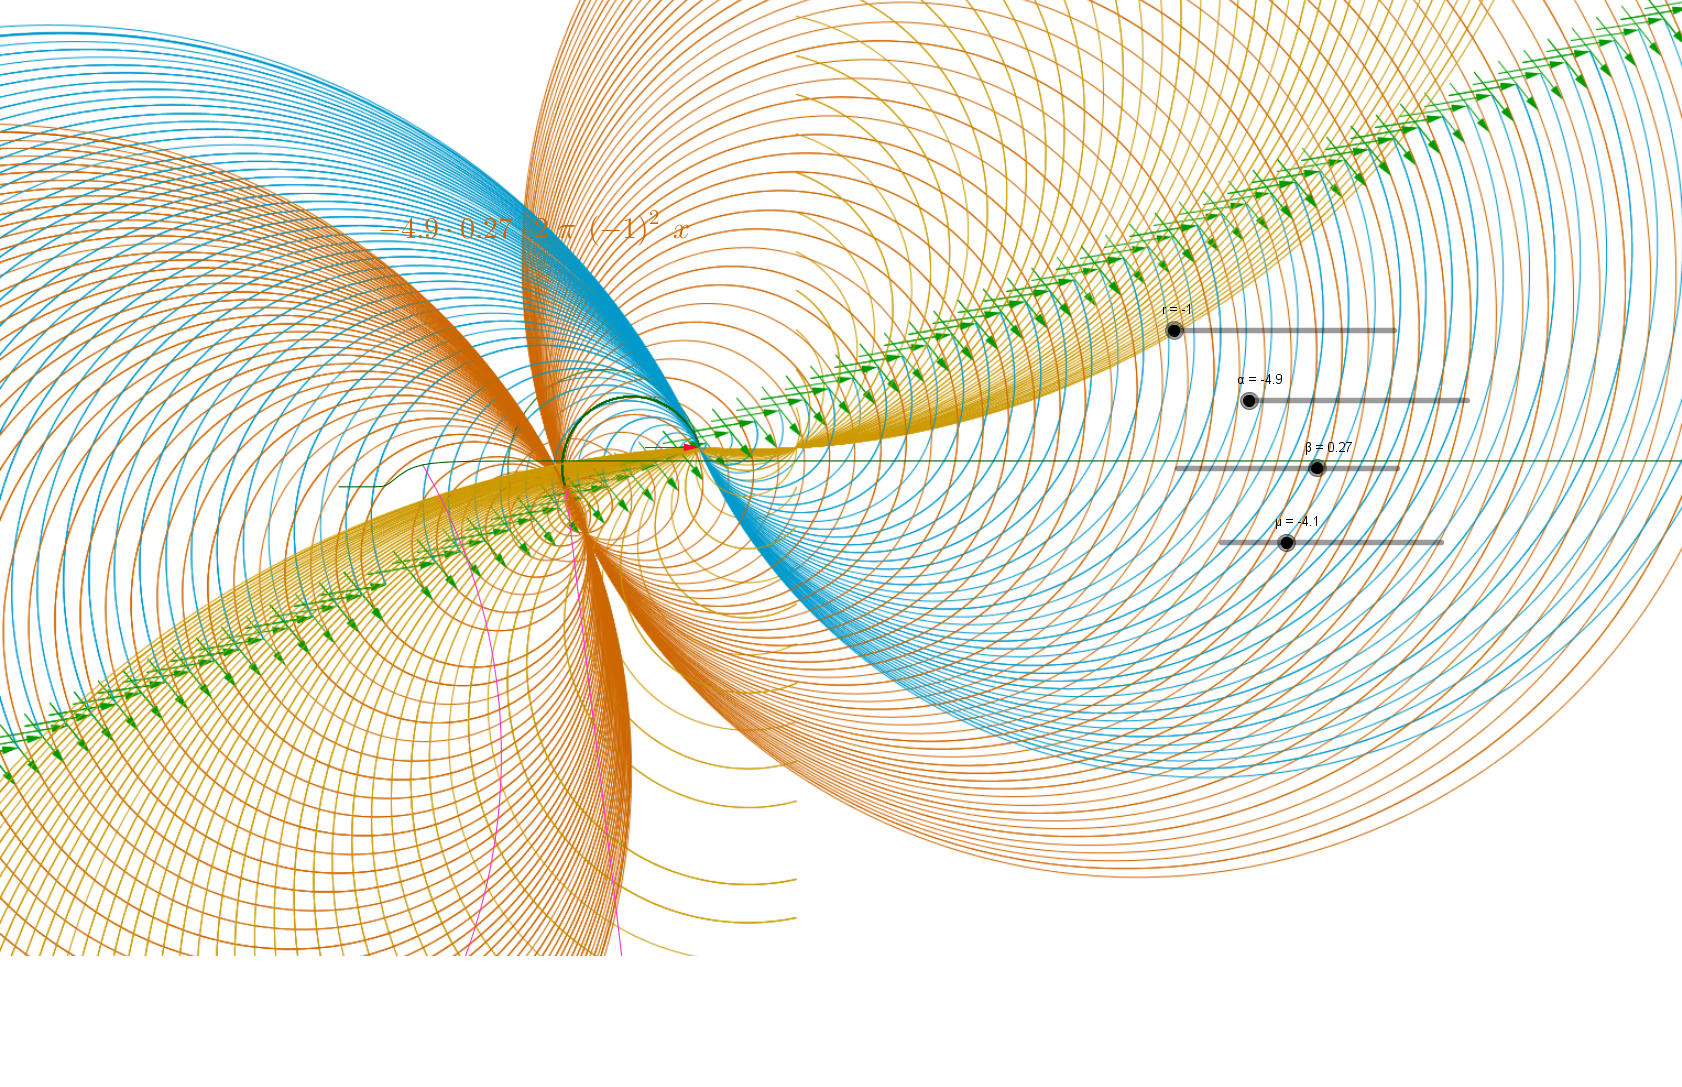
① This example demonstrates a turbulent scatter plot generated by the partial beta function, merging mathematics with visual art. ② The core mathematical concept is the incomplete beta function (an integral), showing how parameter variations affect the distribution of points in 3D space. ③ Construction uses GeoGebra objects A and B as control points, a scatter plot to render points, vectors and algebra operations to compute function values, and possibly secant lines for auxiliary insight. ④ Suitable for high school to university levels, ideal for mathematical art projects, exploring function graphs, or visualizing integral functions in calculus.
GeoGebra Commands & Parameters
Point A(-3.98, -10.22)Point B(20.835, -10.22)
AI Drawing Prompt Reference
Create a turbulent scatter plot generated by the incomplete beta function, merging mathematics with visual art. In 3D space, numerous colored points are randomly distributed, forming dynamic patterns resembling fluid turbulence. Two control points sit at the bottom, one on the left and one on the right, influencing the spread of the scatter. Points diffuse outward from these controls, with density and color gradients varying according to function parameters. The dark background highlights the brightness and layering of the points.
The prompt above was compiled from the original drawing commands and is for reference only.