
Quadratic Function Calculator
Loading the math board and drawing, please wait…
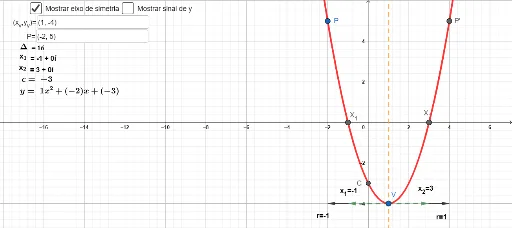
This example demonstrates the graph of quadratic functions and their related properties such as vertex, axis of symmetry, and x-intercepts. Key math concepts include quadratic functions, function graphs, derivatives, integrals, and vectors. It is constructed using GeoGebra commands like Textfield, If, NIntegral, and Vector, with objects like V, P, a, b, c, and vectors. Suitable for high school and above students to understand function properties and geometric meanings.
GeoGebra Commands & Parameters
Textfield(V) → InputBox1Textfield(P) → InputBox2If(d > 0, x1, x1c) → x12If(d > 0, x2, x2c) → x22NIntegral(f, -1000, x(X_{1})) → A1NIntegral(f, x(X_{1}), x(X_{2})) → A2NIntegral(f, x(X_{2}), 1000) → A3NIntegral(f, -1000, x(X_{2})) → AM1NIntegral(f, x(X_{2}), x(X_{1})) → AM2NIntegral(f, x(X_{1}), 1000) → AM3NIntegral(f, -1000, x(X_{1})) → Ad01NIntegral(f, x(X_{1}), 1000) → Ad02NIntegral(f, -1000, 1000) → AdnNIntegral(f, -1000, x(X_{2})) → Adp01NIntegral(f, x(X_{2}), 1000) → Adp03NIntegral(f, -1000, 1000) → NVector(V, R2) → w2Vector(V, R1) → w1Vector(R1, K2) → h1Vector(R2, K1) → hVector(V, K2) → uVector(V, K1) → vVector(R2, K2) → h2Vector(R1, K1) → h3Vector(R2, K1) → h4Vector(R1, K2) → h5Vector(R1, K1) → h6Vector(R2, K2) → h7
AI Drawing Prompt Reference
Draw the graph of a quadratic function, marking its vertex, axis of symmetry, and x-intercepts. Also, calculate and display the integral areas and derivative vectors of the function. Use vector tools to indicate key points and directions, differentiating various parts with colors. Start by plotting the function curve, then add related mathematical elements.
The prompt above was compiled from the original drawing commands and is for reference only.