
Graphing Standard Form Equations (Part 2)
Loading the math board and drawing, please wait…
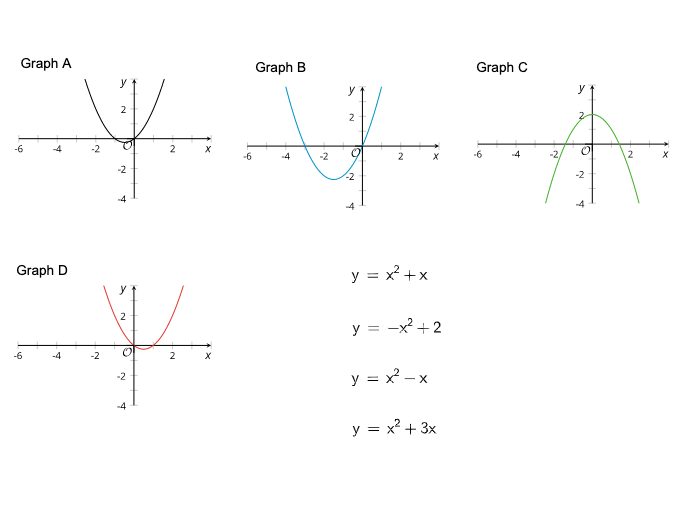
This GeoGebra practice demonstrates how to graph equations given in standard form and how the resulting picture reveals the relationship between key parameters and the geometric shape. It centers on function graphing and the interpretation of slope and differences (the “difference and slope” idea) to connect algebraic structure with visual features on the coordinate plane. The main concepts include functions, coordinate-geometry interpretation of standard form, and reading/using parameters to locate and sketch the correct curve. Construction-wise, the example is typically built by: (1) identifying the crucial parameters from the standard form (e.g., quantities tied to slope/position), (2) creating the corresponding function/curve in GeoGebra within the same axes, and (3) using the plotted curve and marked reference points to verify that the standard-form parameters produce the expected graph. Although no specific GeoGebra command list is provided in the source, the construction generally relies on objects such as function definitions, graphing on a coordinate plane, and optionally sliders/linked parameters for visual comparison. Suitable for late secondary school through early college for students practicing how to move from standard algebraic form to accurate graphing.
AI Drawing Prompt Reference
Draw a function graph in a coordinate system representing standard form equations, showing how key parameters affect the position and shape of the graph, especially the relationship between parameters and slope/position. Define functions based on standard form, mark key points reflecting parameter characteristics, and finally compare the function graph with parameters to verify the connection between the standard form and the visual features of the graph.
The prompt above was compiled from the original drawing commands and is for reference only.