
Parametric Equations Using Theta
Loading the math board and drawing, please wait…
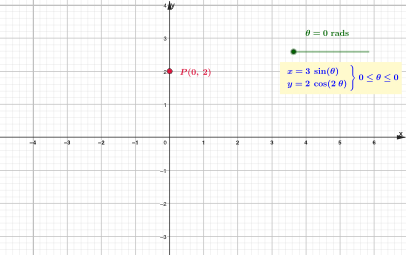
This example demonstrates how to plot graphs using parametric equations involving theta. Key math concepts include parametric equations, scatter plots, median value, angles, cosine, and terms. It uses the GeoGebra command CurveCartesian with objects a, b, P, text1, text2, text3. Suitable for high school students learning coordinate geometry and parametric equations.
GeoGebra Commands & Parameters
CurveCartesian((3 * sin(θ)), (2 * cos((2 * θ))), θ, 0, a) → b
AI Drawing Prompt Reference
Draw a graph controlled by parameter θ, including a point P and some text labels. The coordinates of point P are determined by 3*sin(θ) and 2*cos(2*θ), with θ varying from 0 to a certain value. Text labels are used to annotate key points in the graph. The construction order is to draw point P first, then add text labels.
The prompt above was compiled from the original drawing commands and is for reference only.