
Parametric Curves
Loading the math board and drawing, please wait…
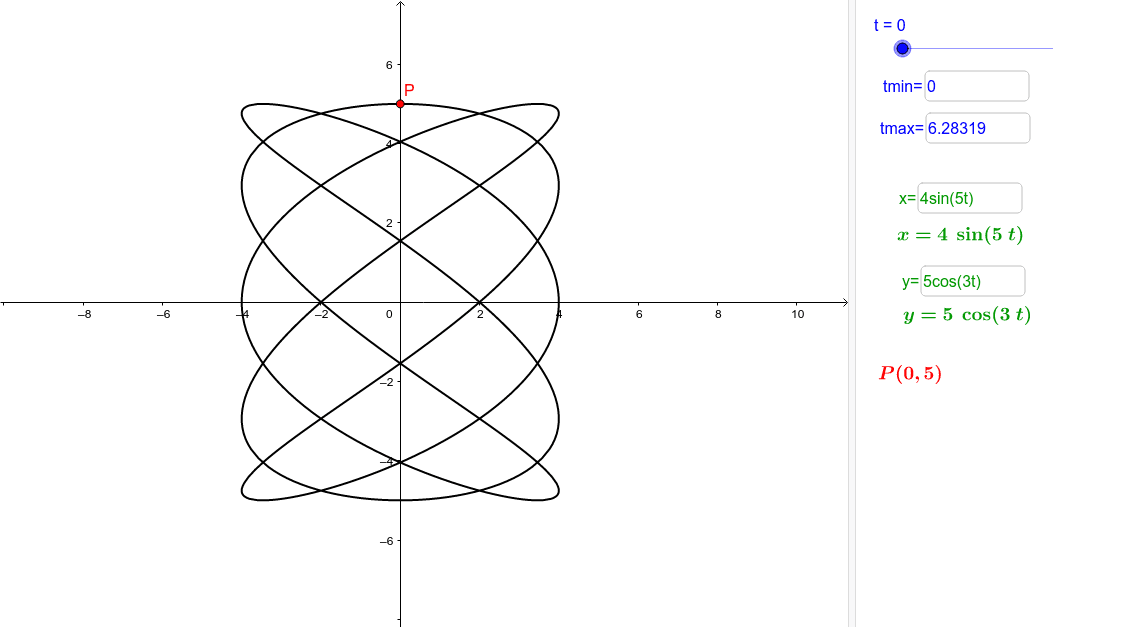
This example demonstrates the method of drawing parametric curves. Parametric curves are curves represented by parametric equations, often used to describe motion trajectories or complex shapes. By adjusting the parameters in the parametric equations, you can observe changes in the curve. This example uses the CurveCartesian command to draw the parametric curve and adjusts parameters using sliders. Suitable for high school mathematics education and learning parametric equations.
GeoGebra Commands & Parameters
Textfield(f) → xEqTextfield(g) → yEqCurveCartesian(f(t), g(t), t, tmin, tmax) → aTextfield(tmin) → TminTextfield(tmax) → Tmax
AI Drawing Prompt Reference
Draw a parametric curve by adjusting parameters in the parametric equations. Input the x-component equation as xEq, the y-component equation as yEq, and set the parameter t's minimum value as Tmin and maximum value as Tmax.
The prompt above was compiled from the original drawing commands and is for reference only.