
Parabola Graph
Loading the math board and drawing, please wait…
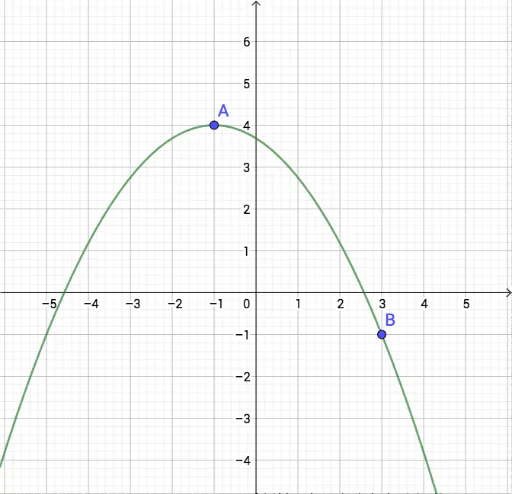
This example demonstrates the graph of a parabola. It involves the core mathematical concepts of functions and coordinate geometry. Using GeoGebra commands, the graph of a parabola is constructed, involving objects such as points A and B, rise, and run. Suitable for high school mathematics education and learning.
GeoGebra Commands & Parameters
Point A(-1, 4)Point B(3, -1)y(B) - y(A)x(B) - x(A)f(x) = (rise / run^(2) * (x - x(A))^(2)) + y(A)
AI Drawing Prompt Reference
Draw a parabola on a coordinate plane. Start by placing two points, one in the upper left and the other in the lower right. Compute the vertical difference and horizontal difference between these points. Using the first point as the vertex, construct a parabola that opens upward, with its shape determined by the ratio of the vertical difference to the square of the horizontal difference, ensuring it passes through the second point. Show the smooth curve and keep both points visible.
The prompt above was compiled from the original drawing commands and is for reference only.