
One Variable Statistical Analysis
Loading the math board and drawing, please wait…
In collections
GGBChat4: Statistics 1
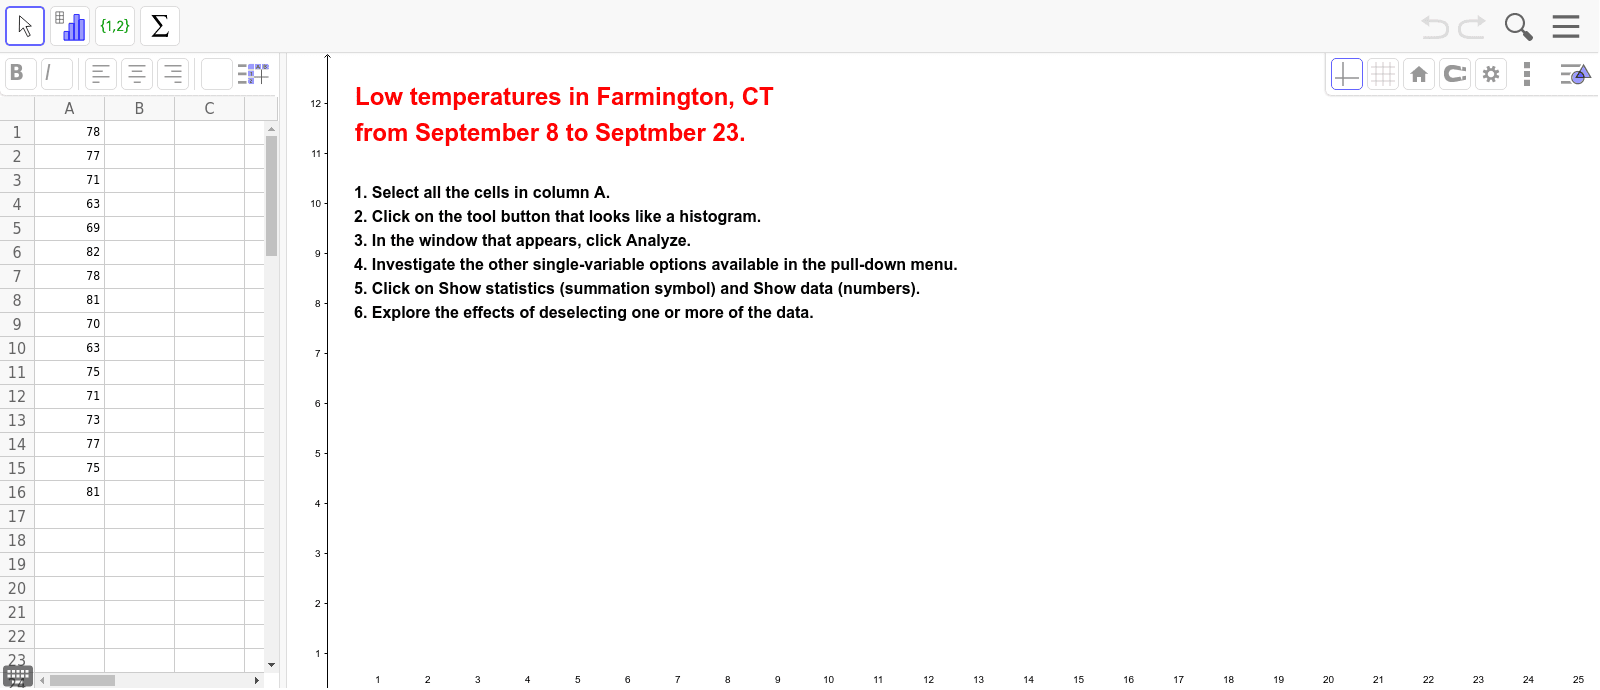
This example demonstrates how to perform one-variable statistical analysis using GeoGebra, including data input, chart generation, and calculation of basic statistics like mean, median, mode, and standard deviation. It involves core mathematical concepts of data distribution and statistical measures. Key GeoGebra commands used include objects A1 to A16 for data points and text1, text2 for displaying statistical results. Suitable for high school mathematics teaching or self-learning to understand data analysis and the application of statistical charts.
GeoGebra Commands & Parameters
Numeric A1(78.0)Numeric A2(77.0)Numeric A3(71.0)Numeric A4(63.0)Numeric A5(69.0)Numeric A6(82.0)Numeric A7(78.0)Numeric A8(81.0)Numeric A9(70.0)Numeric A10(63.0)Numeric A11(75.0)Numeric A12(71.0)Numeric A13(73.0)Numeric A14(77.0)Numeric A15(75.0)Numeric A16(81.0)
AI Drawing Prompt Reference
Create a statistical chart with 16 data points to show data distribution, and label the mean, median, mode, and standard deviation. The chart should visually reflect the overall trend and distribution characteristics of the data.
The prompt above was compiled from the original drawing commands and is for reference only.