
Two Variable Statistics Analysis
Loading the math board and drawing, please wait…
In collections
GGBChat4: Statistics 1
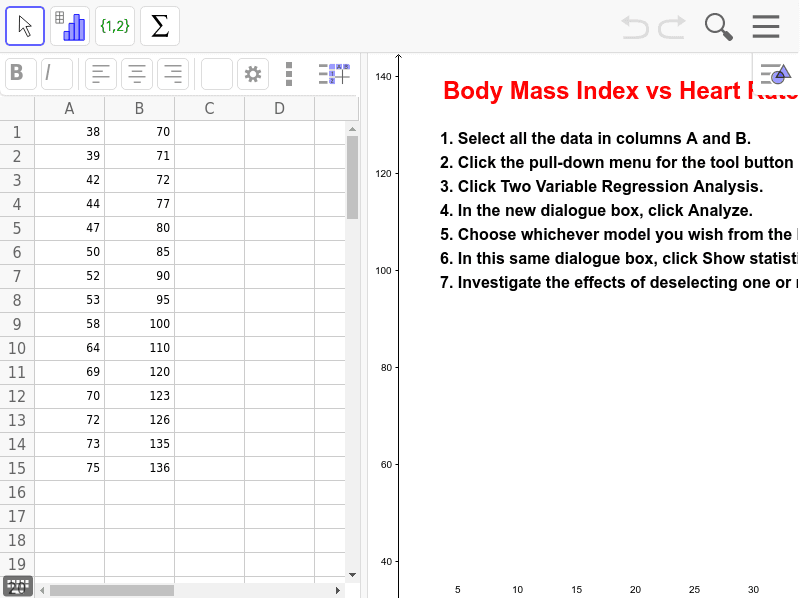
This example demonstrates basic methods of two-variable statistics analysis. Key mathematical concepts include data distribution in statistics and box plots. Using the BoxPlot command, it provides a clear visualization of data distribution. Suitable for high school and above students learning statistics and data analysis.
GeoGebra Commands & Parameters
BoxPlot(1, 0.3333333333333333, {70, 71, 72, 77, 80, 85, 90, 95, 100, 110, 120, 123, 126, 135, 136}, true) →BoxPlot(2, 0.3333333333333333, {38, 39, 42, 44, 47, 50, 52, 53, 58, 64, 69, 70, 72, 73, 75}, true) →Text(" B1:B15 ", (13.5, 1)) →Text(" A1:A15 ", (13.5, 2)) →
AI Drawing Prompt Reference
Create a two-variable statistics analysis graph with two box plots representing the distribution of 15 data points. The first box plot contains the data points 70, 71, 72, 77, 80, 85, 90, 95, 100, 110, 120, 123, 126, 135, 136, and the second box plot contains 38, 39, 42, 44, 47, 50, 52, 53, 58, 64, 69, 70, 72, 73, 75. Add text labels at the x-axis position 13.5, with the first label reading 'B1:B15' and the second label reading 'A1:A15'.
The prompt above was compiled from the original drawing commands and is for reference only.