
Observing More Patterns in Scatter Plots via Random Experiments
Loading the math board and drawing, please wait…
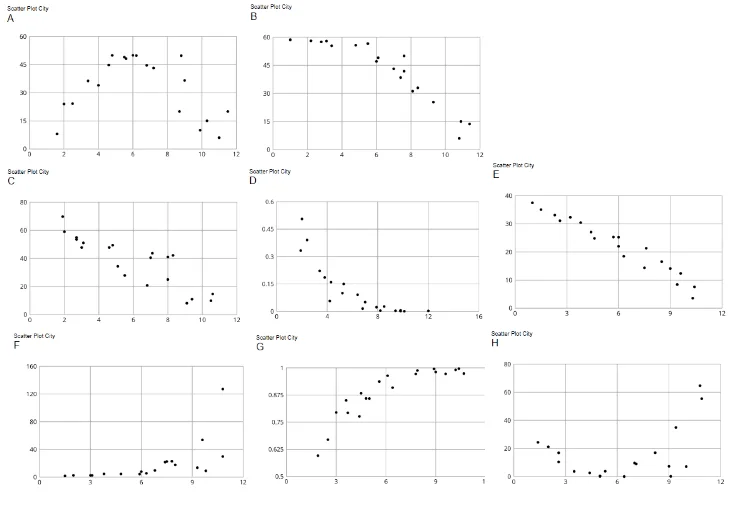
This GeoGebra lesson demonstrates how scatter plots can reveal structure and repeatable patterns even when the underlying points originate from random experiments. Students learn to read trends from a point cloud and compare how the visible patterns change across conditions. Key concepts include coordinate geometry (representing data as points in the plane), functions/relationships as visualized through point sets, and probability & statistics intuition (stability of patterns under random sampling), together with geometric context suggested by related constructions (e.g., polygonal/orthocenter references). Construction-wise, the example is organized into multiple visualization panels (pic1–pic8) and many point objects (A, B, C, D, E, F, …, P), allowing side-by-side comparison of different scatter distributions and stages. This makes it suitable for classroom demonstrations and inquiry-based learning in middle and high school, especially for data visualization and the early study of randomness-informed pattern recognition.
GeoGebra Commands & Parameters
Point A(-12.239549861544045, 1.9015305339057686)Point B(-3.1245396952443945, 1.9015305339057686)Point C(-3.372383958013945, 1.991726867217368)Point D(5.78843027947314, 1.991726867217368)Point E(-12.245746771120302, -4.070213363177229)Point F(-3.084932533633193, -4.070213363177229)Point G(-3.368198171292833, -4.036133799229665)Point H(5.815518101787973, -4.036133799229665)Point I(5.557210402800433, -3.8786431682001763)Point J(14.534808355537779, -3.8786431682001763)Point K(-11.946675144970593, -10.147520013775129)Point L(-3.0148812634206763, -10.147520013775129)Point M(-3.082902876491868, -10.140426726354459)Point N(5.917597111839196, -10.140426726354459)Point O(5.463034424208085, -10.018871622786)Point P(14.669652732882597, -10.018871622786)
AI Drawing Prompt Reference
Create a scatter-plot style diagram on a coordinate plane by placing a collection of points at specified coordinates, arranged as multiple comparative point-cloud distributions. Include pairs of points that are nearly aligned horizontally within the upper region, and similarly include another pair in a lower region. Add the remaining points near these groups with small coordinate offsets so the overall set reflects how the visible structure changes across sampling stages. Place the upper pair first, then the lower pair, and finally add the intermediate offset points to reveal multi-region scatter patterns for observing repeatable structure.
The prompt above was compiled from the original drawing commands and is for reference only.